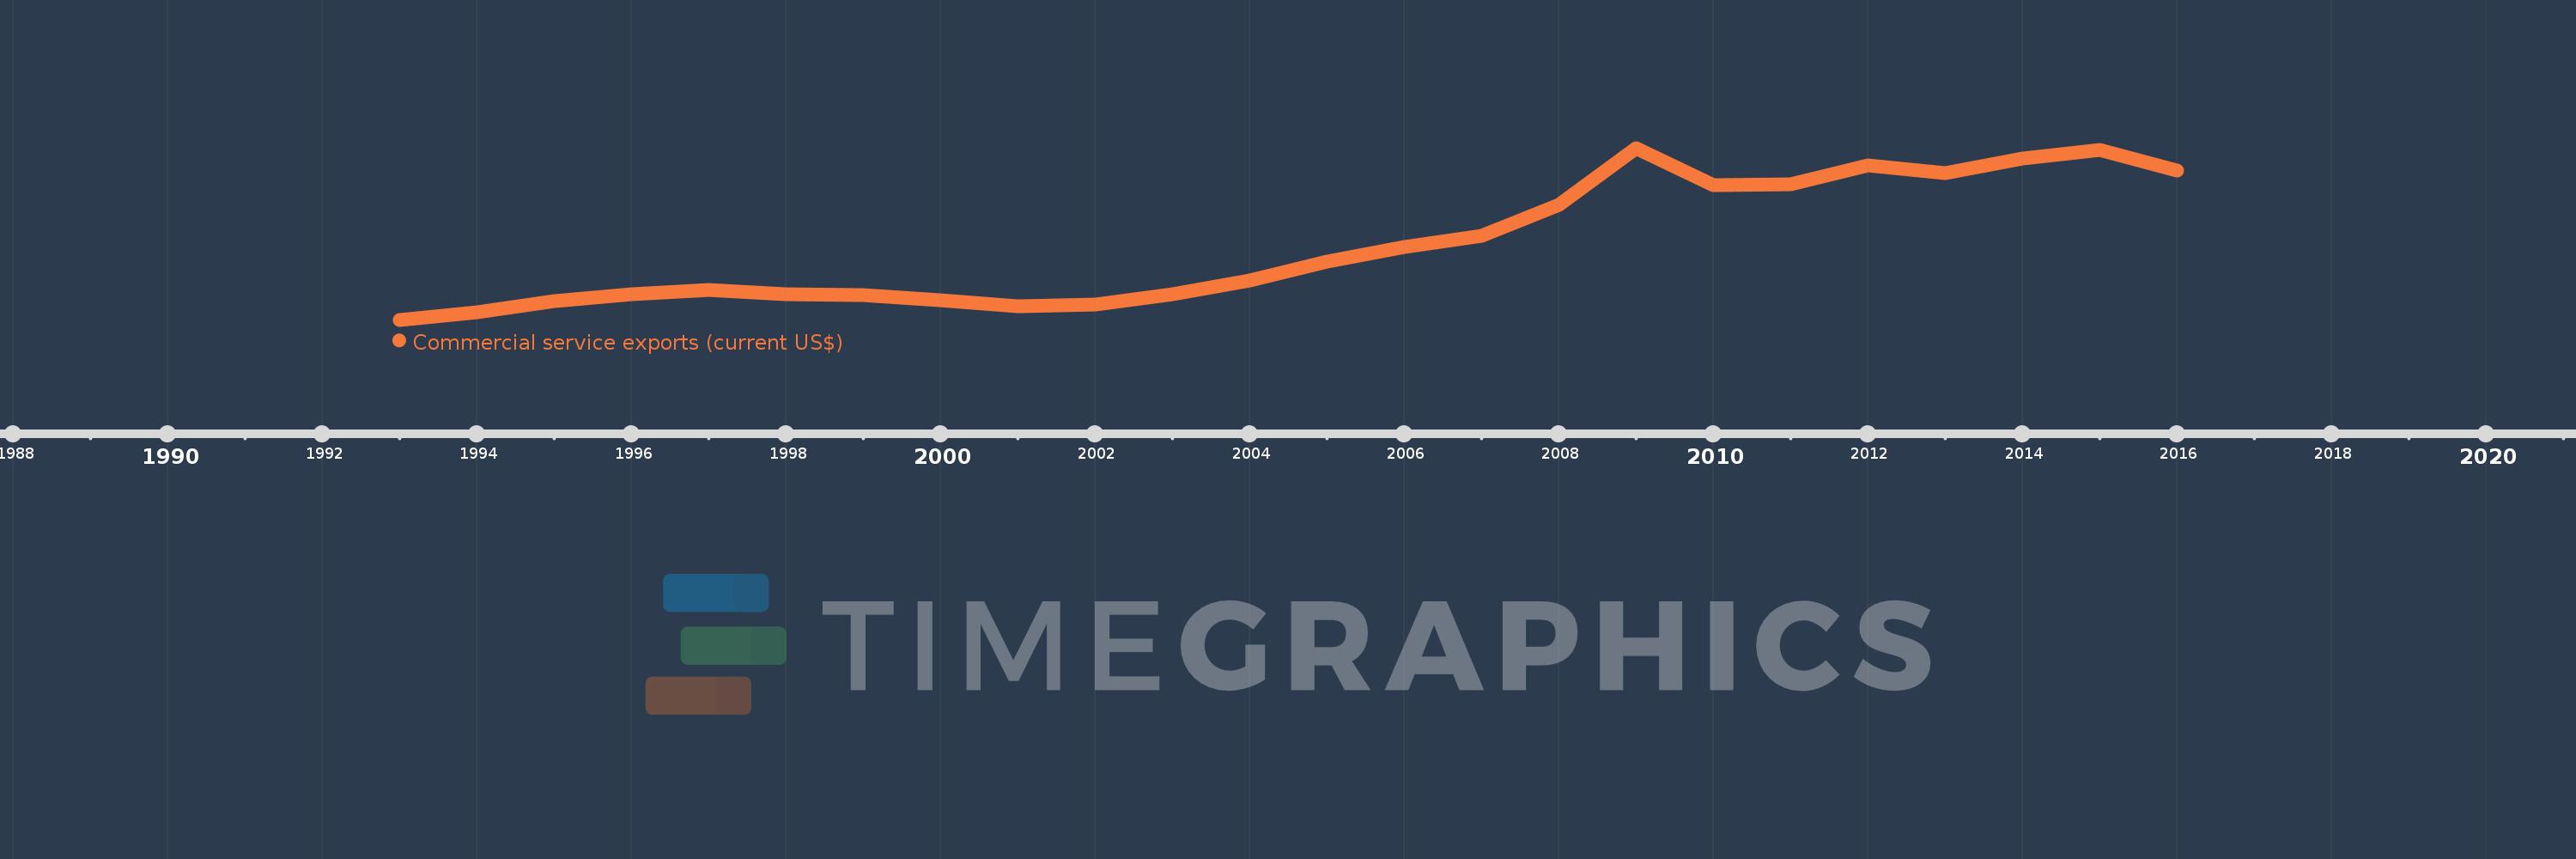
Cette échelle de temps montre un graphique de 1993 année à 2016 année Slovenia. Les données jusqu'à 1992 année ne sont pas présentés. Quantité d'observations actuelles selon dates: 24.
Source (désignation):
Les indicateurs du développement mondiale
Source (organisation):
International Monetary Fund, Balance of Payments Statistics Yearbook and data files.
Catégories:
Private Sector, Trade
Dernière mise à jour
23 avr. 2017
Les indicateurs de changement de valeurs selon les années
En moyenne:
4.041 mds
Minimum:
1.421 mds
1 janv. 1993
Maximum:
7.434 mds
1 janv. 2009
Pour la date d''observation
Valeur
Changement absolu
Le changement par rapport à la valeur précédente
1 janv. 1993
1.421 mds
+1.421 mds
0.0%
1 janv. 1994
1.693 mds
+272.4 mln.
19.17%
1 janv. 1995
2.076 mds
+382.4 mln.
22.58%
1 janv. 1996
2.31 mds
+234.3 mln.
11.29%
1 janv. 1997
2.455 mds
+145.1 mln.
6.28%
1 janv. 1998
2.302 mds
-153.2 mln.
-6.24%
1 janv. 1999
2.294 mds
-7.9 mln.
-0.34%
1 janv. 2000
2.111 mds
-183.2 mln.
-7.99%
1 janv. 2001
1.884 mds
-226.9 mln.
-10.75%
1 janv. 2002
1.958 mds
+73.8 mln.
3.92%
1 janv. 2003
2.311 mds
+353.2 mln.
18.04%
1 janv. 2004
2.786 mds
+475.2 mln.
20.56%
1 janv. 2005
3.454 mds
+668.2 mln.
23.98%
1 janv. 2006
3.97 mds
+515.3 mln.
14.92%
1 janv. 2007
4.35 mds
+379.825 mln.
9.57%
1 janv. 2008
5.451 mds
+1.101 mds
25.31%
1 janv. 2009
7.434 mds
+1.983 mds
36.39%
1 janv. 2010
6.139 mds
-1.295 mds
-17.42%
1 janv. 2011
6.149 mds
+9.736 mln.
0.16%
1 janv. 2012
6.822 mds
+672.548 mln.
10.94%
1 janv. 2013
6.544 mds
-277.775 mln.
-4.07%
1 janv. 2014
7.054 mds
+510.227 mln.
7.8%
1 janv. 2015
7.355 mds
+301.169 mln.
4.27%
1 janv. 2016
6.658 mds
-697.298 mln.
-9.48%
Classement des pays selon les statistiques actuelles par années