30
/fr/
AIzaSyAYiBZKx7MnpbEhh9jyipgxe19OcubqV5w
April 1, 2024
71931
Armenia
ARM
true
2
1
Technical cooperation grants (BoP, current US$)
2015,2014,2013,2012,2011,2010,2009,2008,2007,2006,2005,2004,2003,2002,2001,2000,1999,1998,1997,1996,1995,1994,1993,1992
Download
Bibliothèque de statistiques globales →Armenia →

Technical cooperation grants (BoP, current US$)

Cette statistique dans les autres pays:

AfghanistanAlbaniaAlgeriaAngolaAntigua and BarbudaArgentinaArmeniaArubaAzerbaijanBahamas, TheBahrainBangladeshBarbadosBelarusBelizeBeninBermudaBhutanBoliviaBosnia and HerzegovinaBotswanaBrazilBrunei DarussalamBurkina FasoBurundiCabo VerdeCambodiaCameroonCayman IslandsCentral African RepublicChadChileChinaColombiaComorosCongo, Dem. Rep.Congo, Rep.Costa RicaCote d'IvoireCroatiaCubaCyprusDjiboutiDominicaDominican RepublicEcuadorEgypt, Arab Rep.El SalvadorEquatorial GuineaEritreaEthiopiaFijiFrench PolynesiaGabonGambia, TheGeorgiaGhanaGibraltarGrenadaGuatemalaGuineaGuinea-BissauGuyanaHaitiHondurasHong Kong SAR, ChinaIndiaIndonesiaIran, Islamic Rep.IraqIsraelJamaicaJordanKazakhstanKenyaKiribatiKorea, Dem. People’s Rep.Korea, Rep.KosovoKuwaitKyrgyz RepublicLao PDRLebanonLesothoLiberiaLibyaLow & middle incomeMacedonia, FYRMadagascarMalawiMalaysiaMaldivesMaliMaltaMarshall IslandsMauritaniaMauritiusMexicoMoldovaMongoliaMontenegroMoroccoMozambiqueMyanmarNamibiaNepalNew CaledoniaNicaraguaNigerNigeriaOmanPakistanPalauPanamaPapua New GuineaParaguayPeruPhilippinesQatarRwandaSamoaSao Tome and PrincipeSaudi ArabiaSenegalSerbiaSeychellesSierra LeoneSingaporeSloveniaSolomon IslandsSomaliaSouth AfricaSouth SudanSri LankaSt. Kitts and NevisSt. LuciaSt. Vincent and the GrenadinesSudanSurinameSwazilandSyrian Arab RepublicTajikistanTanzaniaThailandTimor-LesteTogoTongaTrinidad and TobagoTunisiaTurkeyTurkmenistanTurks and Caicos IslandsTuvaluUgandaUkraineUnited Arab EmiratesUruguayUzbekistanVanuatuVenezuela, RBVietnamWest Bank and GazaYemen, Rep.ZambiaZimbabwe

La ligne de temps

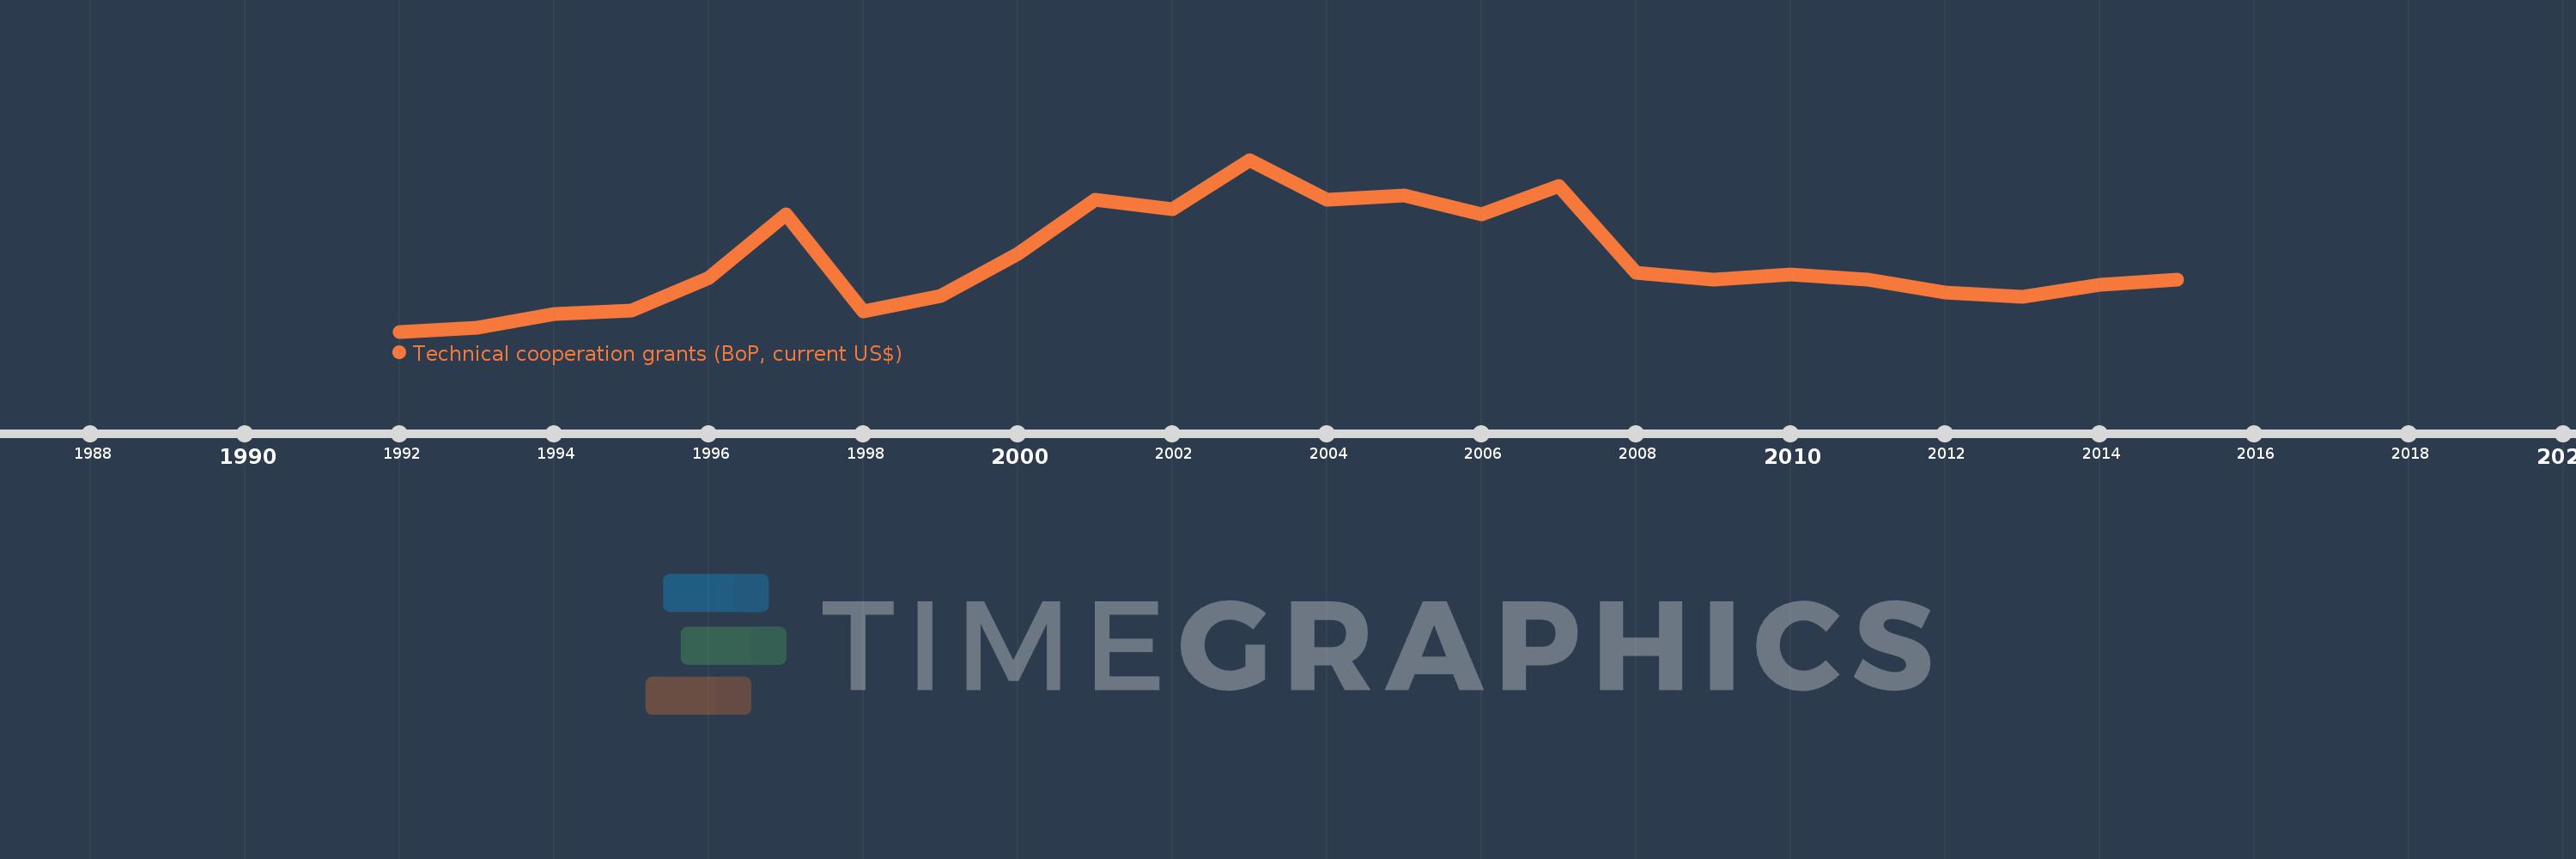
Cette échelle de temps montre un graphique de 1992 année à 2015 année Armenia. Les données jusqu'à 1991 année ne sont pas présentés. Quantité d'observations actuelles selon dates: 24.

Source (désignation):

Les indicateurs du développement mondiale

Source (organisation):

World Bank, International Debt Statistics, and OECD.

Catégories:

Economy & Growth, External Debt, Aid Effectiveness

Dernière mise à jour

23 avr. 2017

Les indicateurs de changement de valeurs selon les années

En moyenne:
50.539 mln.
Minimum:
10.0 milles
1 janv. 1992
Maximum:
122.84 mln.
1 janv. 2003
Pour la date d''observation
Valeur
Changement absolu
Le changement par rapport à la valeur précédente
1 janv. 1992
10.0 milles
+10.0 milles
0.0%
1 janv. 1993
3.07 mln.
+3.06 mln.
30.6 milles%
1 janv. 1994
12.65 mln.
+9.58 mln.
312.05%
1 janv. 1995
14.78 mln.
+2.13 mln.
16.84%
1 janv. 1996
38.35 mln.
+23.57 mln.
159.47%
1 janv. 1997
83.69 mln.
+45.34 mln.
118.23%
1 janv. 1998
14.62 mln.
-69.07 mln.
-82.53%
1 janv. 1999
25.42 mln.
+10.8 mln.
73.87%
1 janv. 2000
55.85 mln.
+30.43 mln.
119.71%
1 janv. 2001
94.2 mln.
+38.35 mln.
68.67%
1 janv. 2002
87.66 mln.
-6.54 mln.
-6.94%
1 janv. 2003
122.84 mln.
+35.18 mln.
40.13%
1 janv. 2004
94.09 mln.
-28.75 mln.
-23.4%
1 janv. 2005
97.28 mln.
+3.19 mln.
3.39%
1 janv. 2006
83.78 mln.
-13.5 mln.
-13.88%
1 janv. 2007
104.15 mln.
+20.37 mln.
24.31%
1 janv. 2008
42.16 mln.
-61.99 mln.
-59.52%
1 janv. 2009
36.88 mln.
-5.28 mln.
-12.52%
1 janv. 2010
40.8 mln.
+3.92 mln.
10.63%
1 janv. 2011
36.98 mln.
-3.82 mln.
-9.36%
1 janv. 2012
28.03 mln.
-8.95 mln.
-24.2%
1 janv. 2013
25.0 mln.
-3.03 mln.
-10.81%
1 janv. 2014
33.4 mln.
+8.4 mln.
33.6%
1 janv. 2015
37.24 mln.
+3.84 mln.
11.5%

Classement des pays selon les statistiques actuelles par années