33
/fr/
AIzaSyAYiBZKx7MnpbEhh9jyipgxe19OcubqV5w
August 1, 2025
279383
Uzbekistan
UZB
true
2
1
Technical cooperation grants (BoP, current US$)
2015,2014,2013,2012,2011,2010,2009,2008,2007,2006,2005,2004,2003,2002,2001,2000,1999,1998,1997,1996,1995,1994,1993
Download
Bibliothèque de statistiques globales →Uzbekistan →

Technical cooperation grants (BoP, current US$)

Cette statistique dans les autres pays:

AfghanistanAlbaniaAlgeriaAngolaAntigua and BarbudaArgentinaArmeniaArubaAzerbaijanBahamas, TheBahrainBangladeshBarbadosBelarusBelizeBeninBermudaBhutanBoliviaBosnia and HerzegovinaBotswanaBrazilBrunei DarussalamBurkina FasoBurundiCabo VerdeCambodiaCameroonCayman IslandsCentral African RepublicChadChileChinaColombiaComorosCongo, Dem. Rep.Congo, Rep.Costa RicaCote d'IvoireCroatiaCubaCyprusDjiboutiDominicaDominican RepublicEcuadorEgypt, Arab Rep.El SalvadorEquatorial GuineaEritreaEthiopiaFijiFrench PolynesiaGabonGambia, TheGeorgiaGhanaGibraltarGrenadaGuatemalaGuineaGuinea-BissauGuyanaHaitiHondurasHong Kong SAR, ChinaIndiaIndonesiaIran, Islamic Rep.IraqIsraelJamaicaJordanKazakhstanKenyaKiribatiKorea, Dem. People’s Rep.Korea, Rep.KosovoKuwaitKyrgyz RepublicLao PDRLebanonLesothoLiberiaLibyaLow & middle incomeMacedonia, FYRMadagascarMalawiMalaysiaMaldivesMaliMaltaMarshall IslandsMauritaniaMauritiusMexicoMoldovaMongoliaMontenegroMoroccoMozambiqueMyanmarNamibiaNepalNew CaledoniaNicaraguaNigerNigeriaOmanPakistanPalauPanamaPapua New GuineaParaguayPeruPhilippinesQatarRwandaSamoaSao Tome and PrincipeSaudi ArabiaSenegalSerbiaSeychellesSierra LeoneSingaporeSloveniaSolomon IslandsSomaliaSouth AfricaSouth SudanSri LankaSt. Kitts and NevisSt. LuciaSt. Vincent and the GrenadinesSudanSurinameSwazilandSyrian Arab RepublicTajikistanTanzaniaThailandTimor-LesteTogoTongaTrinidad and TobagoTunisiaTurkeyTurkmenistanTurks and Caicos IslandsTuvaluUgandaUkraineUnited Arab EmiratesUruguayUzbekistanVanuatuVenezuela, RBVietnamWest Bank and GazaYemen, Rep.ZambiaZimbabwe

La ligne de temps

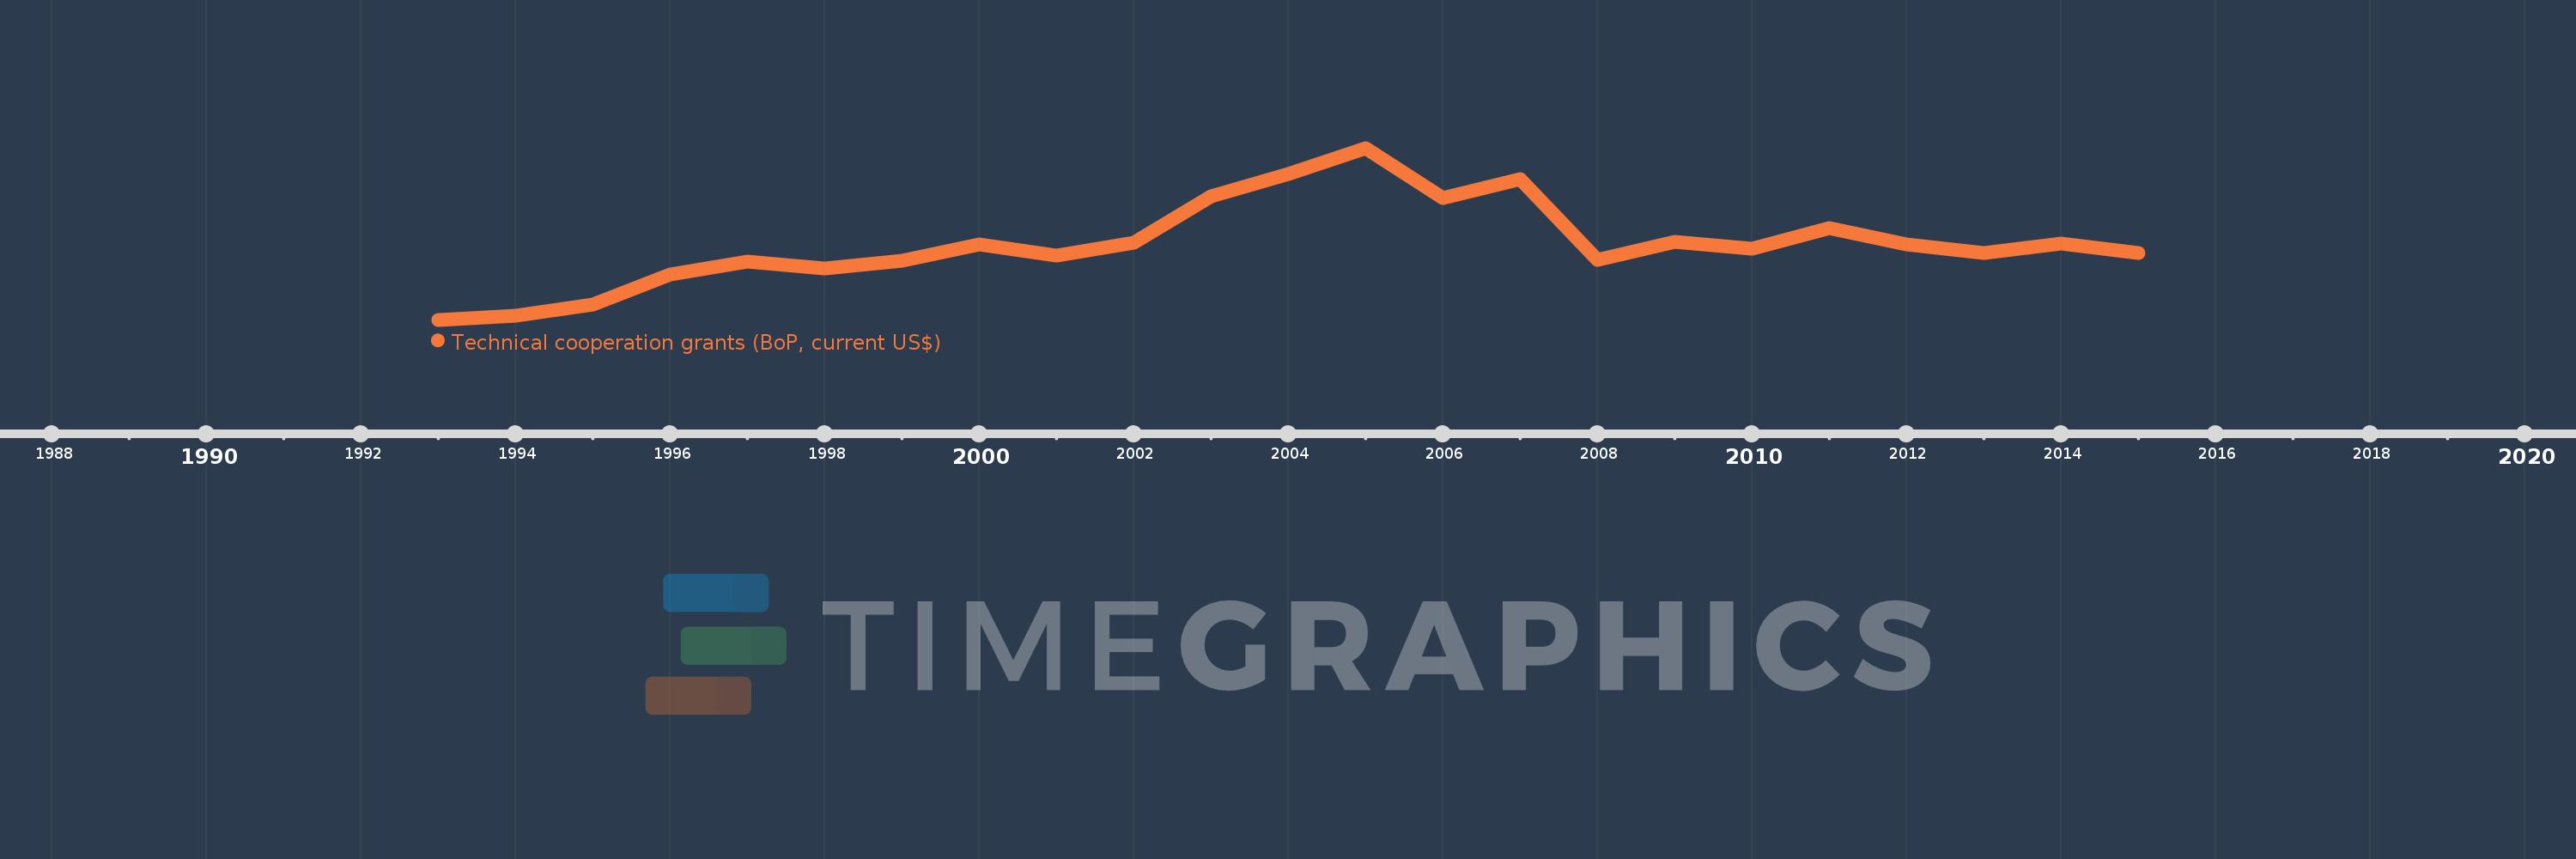
Cette échelle de temps montre un graphique de 1993 année à 2015 année Uzbekistan. Les données jusqu'à 1992 année ne sont pas présentés. Quantité d'observations actuelles selon dates: 23.

Source (désignation):

Les indicateurs du développement mondiale

Source (organisation):

World Bank, International Debt Statistics, and OECD.

Catégories:

Economy & Growth, External Debt, Aid Effectiveness

Dernière mise à jour

23 avr. 2017

Les indicateurs de changement de valeurs selon les années

En moyenne:
45.65 mln.
Minimum:
1.51 mln.
1 janv. 1993
Maximum:
101.86 mln.
1 janv. 2005
Pour la date d''observation
Valeur
Changement absolu
Le changement par rapport à la valeur précédente
1 janv. 1993
1.51 mln.
+1.51 mln.
0.0%
1 janv. 1994
4.06 mln.
+2.55 mln.
168.87%
1 janv. 1995
10.31 mln.
+6.25 mln.
153.94%
1 janv. 1996
27.73 mln.
+17.42 mln.
168.96%
1 janv. 1997
35.3 mln.
+7.57 mln.
27.3%
1 janv. 1998
31.51 mln.
-3.79 mln.
-10.74%
1 janv. 1999
35.95 mln.
+4.44 mln.
14.09%
1 janv. 2000
45.74 mln.
+9.79 mln.
27.23%
1 janv. 2001
39.19 mln.
-6.55 mln.
-14.32%
1 janv. 2002
46.52 mln.
+7.33 mln.
18.7%
1 janv. 2003
73.75 mln.
+27.23 mln.
58.53%
1 janv. 2004
86.65 mln.
+12.9 mln.
17.49%
1 janv. 2005
101.86 mln.
+15.21 mln.
17.55%
1 janv. 2006
72.48 mln.
-29.38 mln.
-28.84%
1 janv. 2007
83.48 mln.
+11.0 mln.
15.18%
1 janv. 2008
36.33 mln.
-47.15 mln.
-56.48%
1 janv. 2009
46.78 mln.
+10.45 mln.
28.76%
1 janv. 2010
43.25 mln.
-3.53 mln.
-7.55%
1 janv. 2011
55.26 mln.
+12.01 mln.
27.77%
1 janv. 2012
45.51 mln.
-9.75 mln.
-17.64%
1 janv. 2013
40.45 mln.
-5.06 mln.
-11.12%
1 janv. 2014
45.86 mln.
+5.41 mln.
13.37%
1 janv. 2015
40.46 mln.
-5.4 mln.
-11.77%

Classement des pays selon les statistiques actuelles par années