29
/fr/
fr
AIzaSyAYiBZKx7MnpbEhh9jyipgxe19OcubqV5w
April 1, 2024
274367
Ukraine
UKR
true
2
1
Technical cooperation grants (BoP, current US$)
2015,2014,2013,2012,2011,2010,2009,2008,2007,2006,2005,2004,2003,2002,2001,2000,1999,1998,1997,1996,1995,1994,1993,1992
Download
Bibliothèque de statistiques globales →Ukraine →

Technical cooperation grants (BoP, current US$)

Cette statistique dans les autres pays:
AfghanistanAlbaniaAlgeriaAngolaAntigua and BarbudaArgentinaArmeniaArubaAzerbaijanBahamas, TheBahrainBangladeshBarbadosBelarusBelizeBeninBermudaBhutanBoliviaBosnia and HerzegovinaBotswanaBrazilBrunei DarussalamBurkina FasoBurundiCabo VerdeCambodiaCameroonCayman IslandsCentral African RepublicChadChileChinaColombiaComorosCongo, Dem. Rep.Congo, Rep.Costa RicaCote d'IvoireCroatiaCubaCyprusDjiboutiDominicaDominican RepublicEcuadorEgypt, Arab Rep.El SalvadorEquatorial GuineaEritreaEthiopiaFijiFrench PolynesiaGabonGambia, TheGeorgiaGhanaGibraltarGrenadaGuatemalaGuineaGuinea-BissauGuyanaHaitiHondurasHong Kong SAR, ChinaIndiaIndonesiaIran, Islamic Rep.IraqIsraelJamaicaJordanKazakhstanKenyaKiribatiKorea, Dem. People’s Rep.Korea, Rep.KosovoKuwaitKyrgyz RepublicLao PDRLebanonLesothoLiberiaLibyaLow & middle incomeMacedonia, FYRMadagascarMalawiMalaysiaMaldivesMaliMaltaMarshall IslandsMauritaniaMauritiusMexicoMoldovaMongoliaMontenegroMoroccoMozambiqueMyanmarNamibiaNepalNew CaledoniaNicaraguaNigerNigeriaOmanPakistanPalauPanamaPapua New GuineaParaguayPeruPhilippinesQatarRwandaSamoaSao Tome and PrincipeSaudi ArabiaSenegalSerbiaSeychellesSierra LeoneSingaporeSloveniaSolomon IslandsSomaliaSouth AfricaSouth SudanSri LankaSt. Kitts and NevisSt. LuciaSt. Vincent and the GrenadinesSudanSurinameSwazilandSyrian Arab RepublicTajikistanTanzaniaThailandTimor-LesteTogoTongaTrinidad and TobagoTunisiaTurkeyTurkmenistanTurks and Caicos IslandsTuvaluUgandaUkraineUnited Arab EmiratesUruguayUzbekistanVanuatuVenezuela, RBVietnamWest Bank and GazaYemen, Rep.ZambiaZimbabwe
La ligne de temps
Cette échelle de temps montre un graphique de 1992 année à 2015 année Ukraine. Les données jusqu'à 1991 année ne sont pas présentés. Quantité d'observations actuelles selon dates: 24.
Source (désignation):
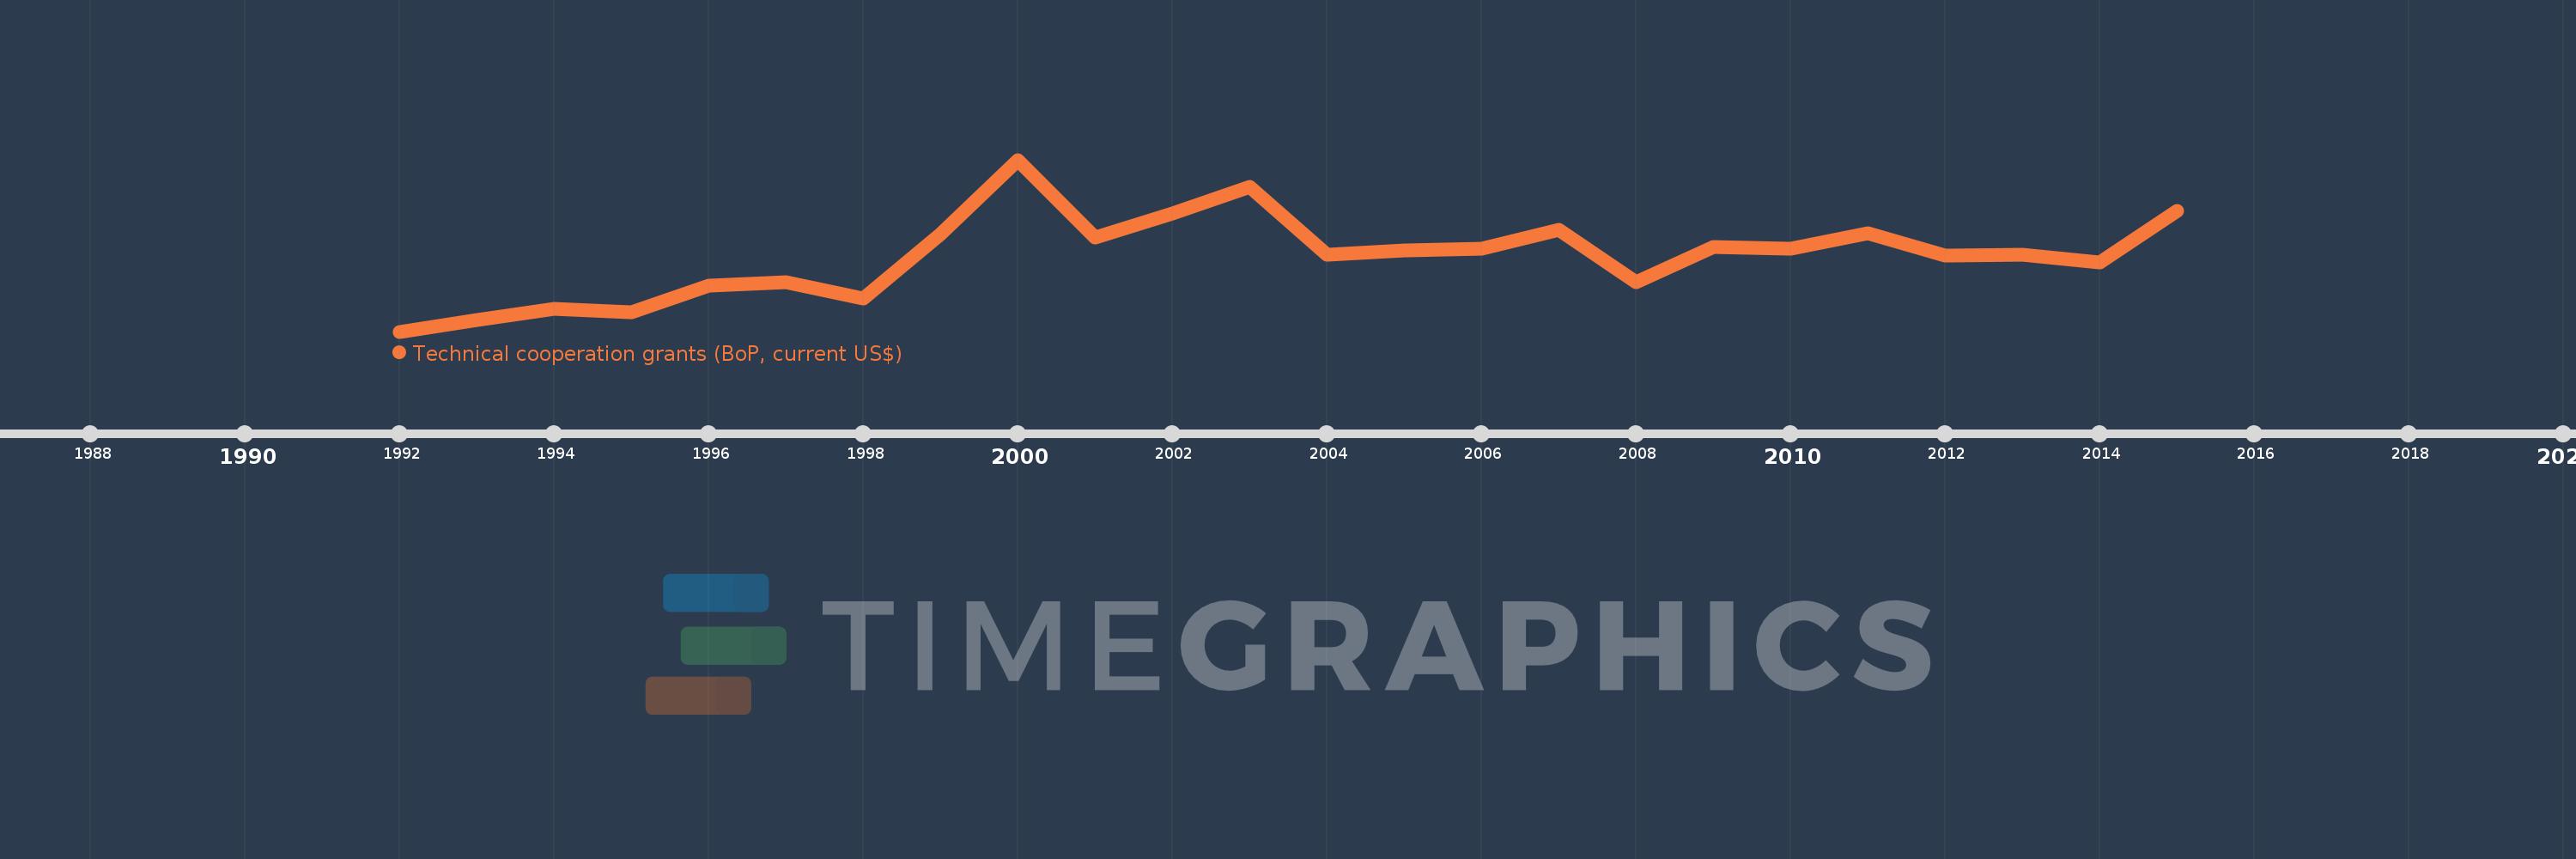
Les indicateurs du développement mondiale
Source (organisation):
World Bank, International Debt Statistics, and OECD.
Catégories:
Economy & Growth, External Debt, Aid Effectiveness
Dernière mise à jour
23 avr. 2017
Les indicateurs de changement de valeurs selon les années
En moyenne:
193.984 mln.
Minimum:
2.9 mln.
1 janv. 1992
Maximum:
438.53 mln.
1 janv. 2000
Pour la date d''observation
Valeur
Changement absolu
Le changement par rapport à la valeur précédente
1 janv. 1992
2.9 mln.
+2.9 mln.
0.0%
1 janv. 1993
32.47 mln.
+29.57 mln.
1.02 milles%
1 janv. 1994
60.1 mln.
+27.63 mln.
85.09%
1 janv. 1995
52.15 mln.
-7.95 mln.
-13.23%
1 janv. 1996
119.07 mln.
+66.92 mln.
128.32%
1 janv. 1997
127.37 mln.
+8.3 mln.
6.97%
1 janv. 1998
85.89 mln.
-41.48 mln.
-32.57%
1 janv. 1999
250.08 mln.
+164.19 mln.
191.16%
1 janv. 2000
438.53 mln.
+188.45 mln.
75.36%
1 janv. 2001
241.31 mln.
-197.22 mln.
-44.97%
1 janv. 2002
303.0 mln.
+61.69 mln.
25.56%
1 janv. 2003
369.42 mln.
+66.42 mln.
21.92%
1 janv. 2004
198.89 mln.
-170.53 mln.
-46.16%
1 janv. 2005
208.07 mln.
+9.18 mln.
4.62%
1 janv. 2006
213.5 mln.
+5.43 mln.
2.61%
1 janv. 2007
260.81 mln.
+47.31 mln.
22.16%
1 janv. 2008
127.35 mln.
-133.46 mln.
-51.17%
1 janv. 2009
217.52 mln.
+90.17 mln.
70.8%
1 janv. 2010
213.83 mln.
-3.69 mln.
-1.7%
1 janv. 2011
252.4 mln.
+38.57 mln.
18.04%
1 janv. 2012
196.36 mln.
-56.04 mln.
-22.2%
1 janv. 2013
198.25 mln.
+1.89 mln.
0.96%
1 janv. 2014
177.7 mln.
-20.55 mln.
-10.37%
1 janv. 2015
308.64 mln.
+130.94 mln.
73.69%
Classement des pays selon les statistiques actuelles par années

Commentaires:

Envoyer
PremiumAbout & FeedbackUn accordConfidentialité
logo
© 2022 Selected Technologies LLC – Morgan Hill, California