33
/fr/
AIzaSyAYiBZKx7MnpbEhh9jyipgxe19OcubqV5w
August 1, 2025
237883
Serbia
SRB
true
2
1
Technical cooperation grants (BoP, current US$)
2015,2014,2013,2012,2011,2010,2009,2008,2007,2006,2005,2004,2003,2002,2001,2000,1999,1998,1997,1996,1995
Download
Bibliothèque de statistiques globales →Serbia →

Technical cooperation grants (BoP, current US$)

Cette statistique dans les autres pays:

AfghanistanAlbaniaAlgeriaAngolaAntigua and BarbudaArgentinaArmeniaArubaAzerbaijanBahamas, TheBahrainBangladeshBarbadosBelarusBelizeBeninBermudaBhutanBoliviaBosnia and HerzegovinaBotswanaBrazilBrunei DarussalamBurkina FasoBurundiCabo VerdeCambodiaCameroonCayman IslandsCentral African RepublicChadChileChinaColombiaComorosCongo, Dem. Rep.Congo, Rep.Costa RicaCote d'IvoireCroatiaCubaCyprusDjiboutiDominicaDominican RepublicEcuadorEgypt, Arab Rep.El SalvadorEquatorial GuineaEritreaEthiopiaFijiFrench PolynesiaGabonGambia, TheGeorgiaGhanaGibraltarGrenadaGuatemalaGuineaGuinea-BissauGuyanaHaitiHondurasHong Kong SAR, ChinaIndiaIndonesiaIran, Islamic Rep.IraqIsraelJamaicaJordanKazakhstanKenyaKiribatiKorea, Dem. People’s Rep.Korea, Rep.KosovoKuwaitKyrgyz RepublicLao PDRLebanonLesothoLiberiaLibyaLow & middle incomeMacedonia, FYRMadagascarMalawiMalaysiaMaldivesMaliMaltaMarshall IslandsMauritaniaMauritiusMexicoMoldovaMongoliaMontenegroMoroccoMozambiqueMyanmarNamibiaNepalNew CaledoniaNicaraguaNigerNigeriaOmanPakistanPalauPanamaPapua New GuineaParaguayPeruPhilippinesQatarRwandaSamoaSao Tome and PrincipeSaudi ArabiaSenegalSerbiaSeychellesSierra LeoneSingaporeSloveniaSolomon IslandsSomaliaSouth AfricaSouth SudanSri LankaSt. Kitts and NevisSt. LuciaSt. Vincent and the GrenadinesSudanSurinameSwazilandSyrian Arab RepublicTajikistanTanzaniaThailandTimor-LesteTogoTongaTrinidad and TobagoTunisiaTurkeyTurkmenistanTurks and Caicos IslandsTuvaluUgandaUkraineUnited Arab EmiratesUruguayUzbekistanVanuatuVenezuela, RBVietnamWest Bank and GazaYemen, Rep.ZambiaZimbabwe

La ligne de temps

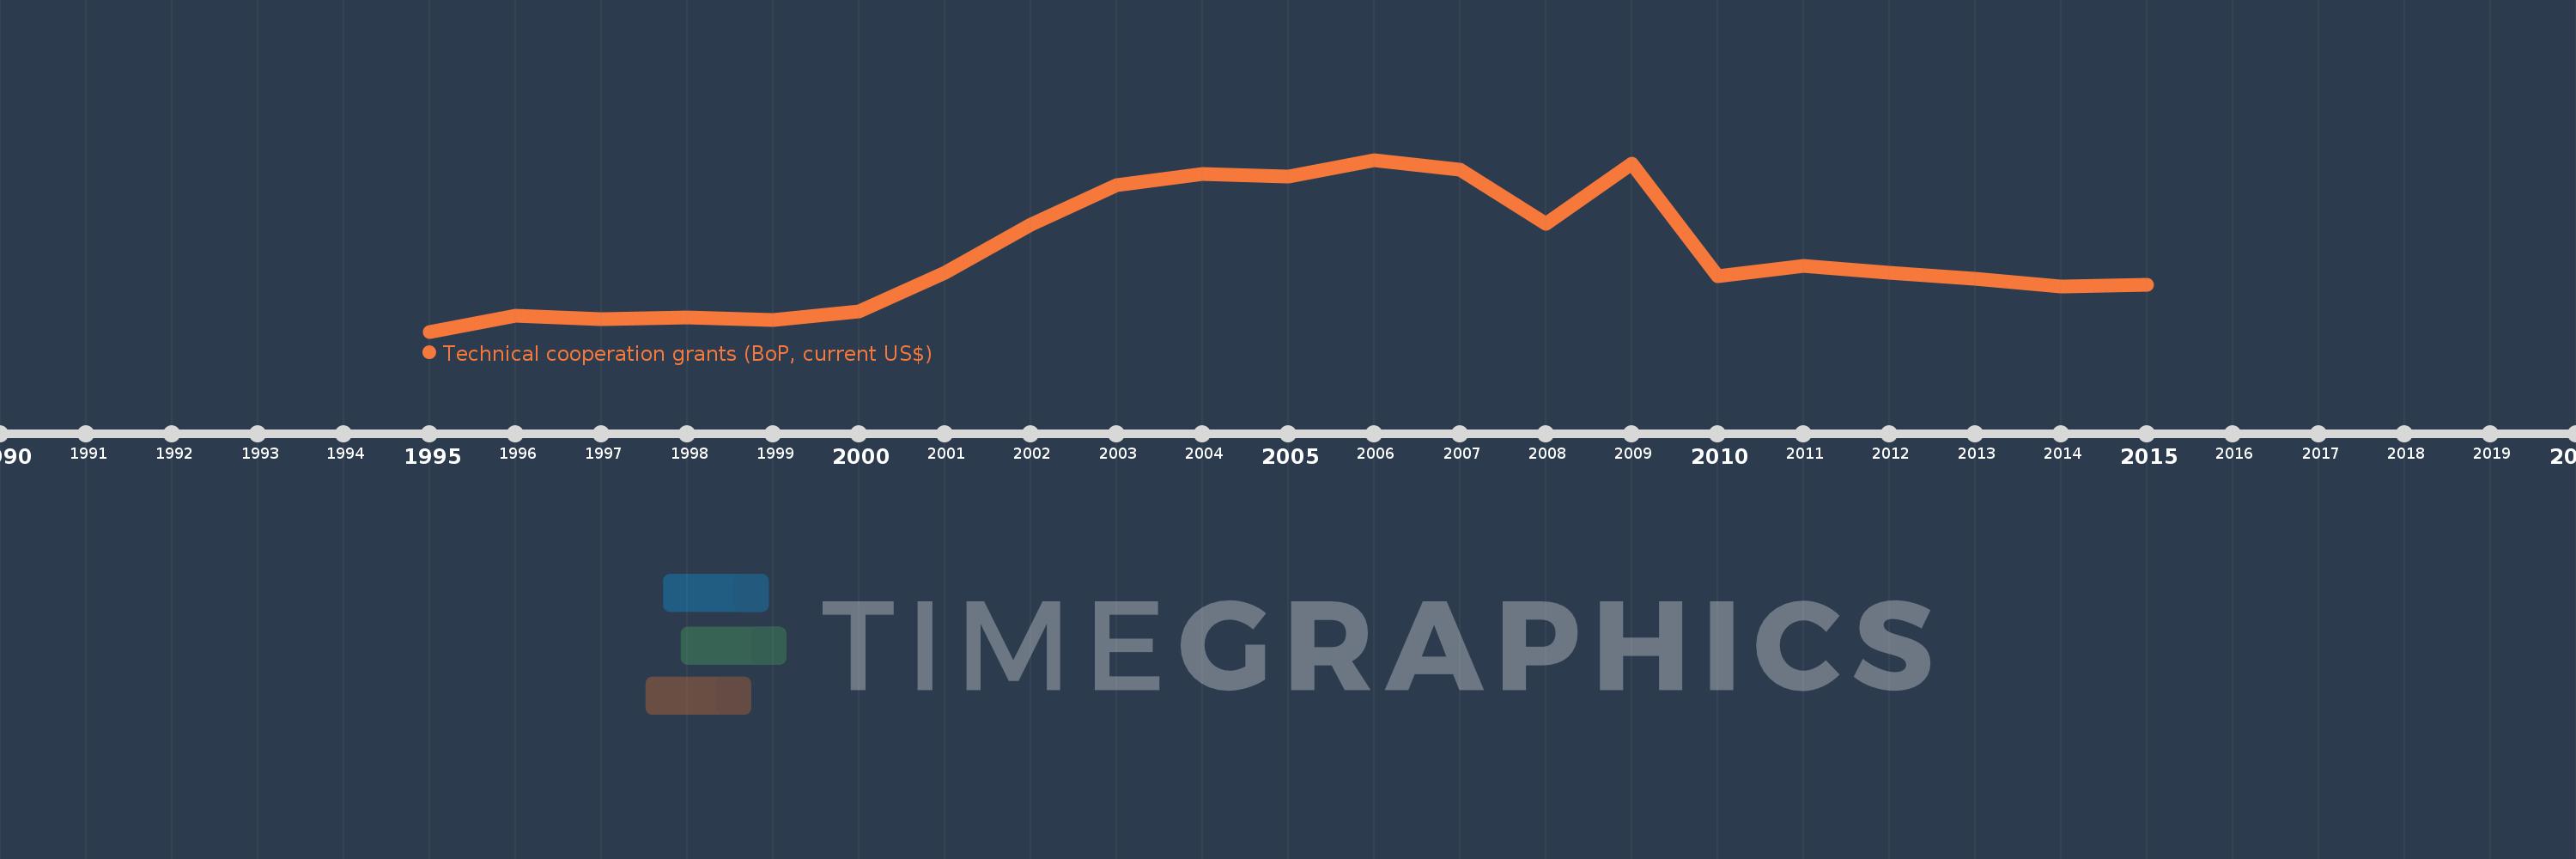
Cette échelle de temps montre un graphique de 1995 année à 2015 année Serbia. Les données jusqu'à 1994 année ne sont pas présentés. Quantité d'observations actuelles selon dates: 21.

Source (désignation):

Les indicateurs du développement mondiale

Source (organisation):

World Bank, International Debt Statistics, and OECD.

Catégories:

Economy & Growth, External Debt, Aid Effectiveness

Dernière mise à jour

23 avr. 2017

Les indicateurs de changement de valeurs selon les années

En moyenne:
153.003 mln.
Minimum:
7.03 mln.
1 janv. 1995
Maximum:
329.36 mln.
1 janv. 2006
Pour la date d''observation
Valeur
Changement absolu
Le changement par rapport à la valeur précédente
1 janv. 1995
7.03 mln.
+7.03 mln.
0.0%
1 janv. 1996
36.98 mln.
+29.95 mln.
426.03%
1 janv. 1997
30.96 mln.
-6.02 mln.
-16.28%
1 janv. 1998
33.88 mln.
+2.92 mln.
9.43%
1 janv. 1999
28.27 mln.
-5.61 mln.
-16.56%
1 janv. 2000
45.07 mln.
+16.8 mln.
59.43%
1 janv. 2001
117.89 mln.
+72.82 mln.
161.57%
1 janv. 2002
207.54 mln.
+89.65 mln.
76.05%
1 janv. 2003
281.88 mln.
+74.34 mln.
35.82%
1 janv. 2004
303.24 mln.
+21.36 mln.
7.58%
1 janv. 2005
298.71 mln.
-4.53 mln.
-1.49%
1 janv. 2006
329.36 mln.
+30.65 mln.
10.26%
1 janv. 2007
310.23 mln.
-19.13 mln.
-5.81%
1 janv. 2008
208.56 mln.
-101.67 mln.
-32.77%
1 janv. 2009
322.52 mln.
+113.96 mln.
54.64%
1 janv. 2010
111.13 mln.
-211.39 mln.
-65.54%
1 janv. 2011
129.78 mln.
+18.65 mln.
16.78%
1 janv. 2012
118.18 mln.
-11.6 mln.
-8.94%
1 janv. 2013
105.58 mln.
-12.6 mln.
-10.66%
1 janv. 2014
91.85 mln.
-13.73 mln.
-13.0%
1 janv. 2015
94.42 mln.
+2.57 mln.
2.8%

Classement des pays selon les statistiques actuelles par années