29
/fr/
fr
AIzaSyAYiBZKx7MnpbEhh9jyipgxe19OcubqV5w
April 1, 2024
260327
Tajikistan
TJK
true
2
1
Technical cooperation grants (BoP, current US$)
2015,2014,2013,2012,2011,2010,2009,2008,2007,2006,2005,2004,2003,2002,2001,2000,1999,1998,1997,1996,1995,1994,1993
Download
Bibliothèque de statistiques globales →Tajikistan →

Technical cooperation grants (BoP, current US$)

Cette statistique dans les autres pays:
AfghanistanAlbaniaAlgeriaAngolaAntigua and BarbudaArgentinaArmeniaArubaAzerbaijanBahamas, TheBahrainBangladeshBarbadosBelarusBelizeBeninBermudaBhutanBoliviaBosnia and HerzegovinaBotswanaBrazilBrunei DarussalamBurkina FasoBurundiCabo VerdeCambodiaCameroonCayman IslandsCentral African RepublicChadChileChinaColombiaComorosCongo, Dem. Rep.Congo, Rep.Costa RicaCote d'IvoireCroatiaCubaCyprusDjiboutiDominicaDominican RepublicEcuadorEgypt, Arab Rep.El SalvadorEquatorial GuineaEritreaEthiopiaFijiFrench PolynesiaGabonGambia, TheGeorgiaGhanaGibraltarGrenadaGuatemalaGuineaGuinea-BissauGuyanaHaitiHondurasHong Kong SAR, ChinaIndiaIndonesiaIran, Islamic Rep.IraqIsraelJamaicaJordanKazakhstanKenyaKiribatiKorea, Dem. People’s Rep.Korea, Rep.KosovoKuwaitKyrgyz RepublicLao PDRLebanonLesothoLiberiaLibyaLow & middle incomeMacedonia, FYRMadagascarMalawiMalaysiaMaldivesMaliMaltaMarshall IslandsMauritaniaMauritiusMexicoMoldovaMongoliaMontenegroMoroccoMozambiqueMyanmarNamibiaNepalNew CaledoniaNicaraguaNigerNigeriaOmanPakistanPalauPanamaPapua New GuineaParaguayPeruPhilippinesQatarRwandaSamoaSao Tome and PrincipeSaudi ArabiaSenegalSerbiaSeychellesSierra LeoneSingaporeSloveniaSolomon IslandsSomaliaSouth AfricaSouth SudanSri LankaSt. Kitts and NevisSt. LuciaSt. Vincent and the GrenadinesSudanSurinameSwazilandSyrian Arab RepublicTajikistanTanzaniaThailandTimor-LesteTogoTongaTrinidad and TobagoTunisiaTurkeyTurkmenistanTurks and Caicos IslandsTuvaluUgandaUkraineUnited Arab EmiratesUruguayUzbekistanVanuatuVenezuela, RBVietnamWest Bank and GazaYemen, Rep.ZambiaZimbabwe
La ligne de temps
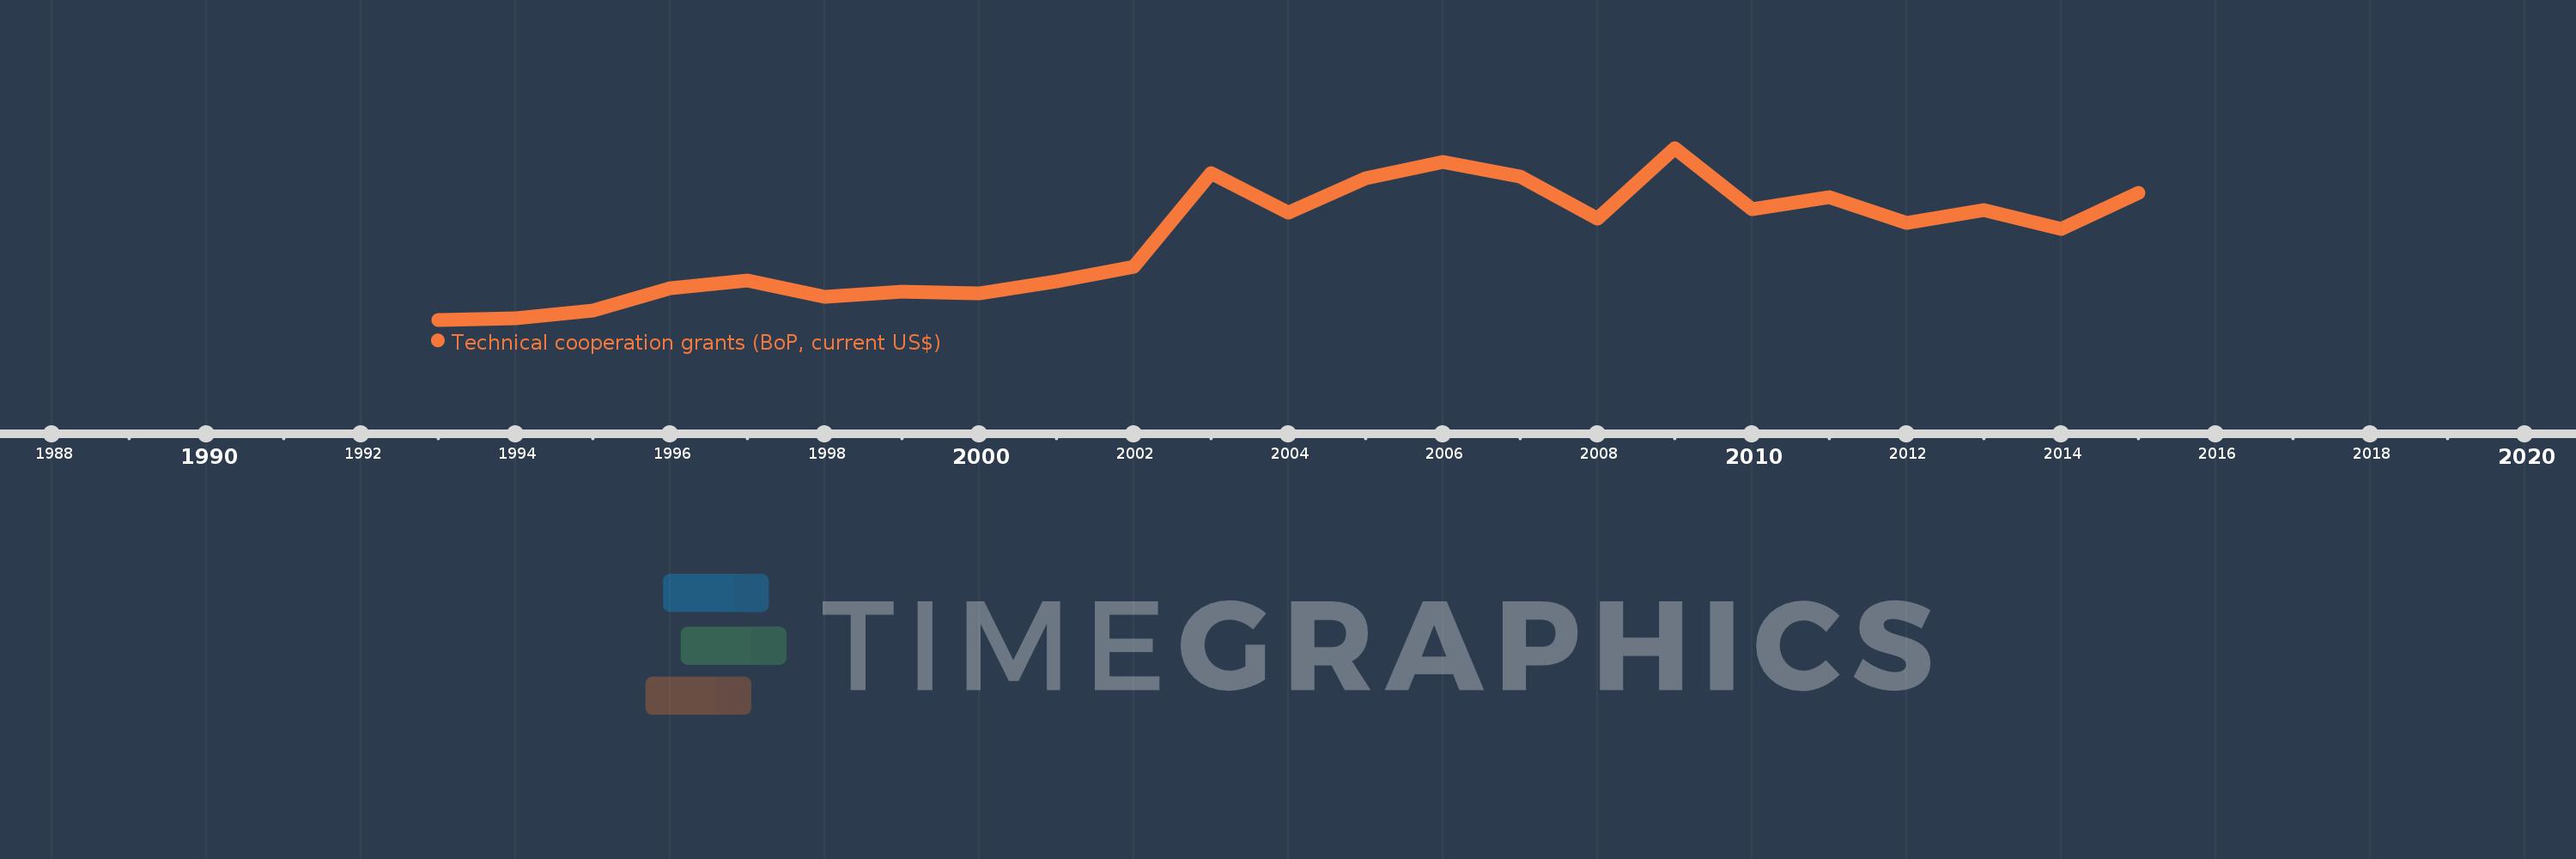
Cette échelle de temps montre un graphique de 1993 année à 2015 année Tajikistan. Les données jusqu'à 1992 année ne sont pas présentés. Quantité d'observations actuelles selon dates: 23.
Source (désignation):
Les indicateurs du développement mondiale
Source (organisation):
World Bank, International Debt Statistics, and OECD.
Catégories:
Economy & Growth, External Debt, Aid Effectiveness
Dernière mise à jour
23 avr. 2017
Les indicateurs de changement de valeurs selon les années
En moyenne:
28.973 mln.
Minimum:
490.0 milles
1 janv. 1993
Maximum:
60.43 mln.
1 janv. 2009
Pour la date d''observation
Valeur
Changement absolu
Le changement par rapport à la valeur précédente
1 janv. 1993
490.0 milles
+490.0 milles
0.0%
1 janv. 1994
1.05 mln.
+560.0 milles
114.29%
1 janv. 1995
3.84 mln.
+2.79 mln.
265.71%
1 janv. 1996
11.52 mln.
+7.68 mln.
200.0%
1 janv. 1997
14.21 mln.
+2.69 mln.
23.35%
1 janv. 1998
8.6 mln.
-5.61 mln.
-39.48%
1 janv. 1999
10.32 mln.
+1.72 mln.
20.0%
1 janv. 2000
9.81 mln.
-510.0 milles
-4.94%
1 janv. 2001
13.93 mln.
+4.12 mln.
42.0%
1 janv. 2002
18.85 mln.
+4.92 mln.
35.32%
1 janv. 2003
51.6 mln.
+32.75 mln.
173.74%
1 janv. 2004
37.95 mln.
-13.65 mln.
-26.45%
1 janv. 2005
49.99 mln.
+12.04 mln.
31.73%
1 janv. 2006
55.49 mln.
+5.5 mln.
11.0%
1 janv. 2007
50.37 mln.
-5.12 mln.
-9.23%
1 janv. 2008
35.71 mln.
-14.66 mln.
-29.1%
1 janv. 2009
60.43 mln.
+24.72 mln.
69.22%
1 janv. 2010
39.17 mln.
-21.26 mln.
-35.18%
1 janv. 2011
43.2 mln.
+4.03 mln.
10.29%
1 janv. 2012
34.37 mln.
-8.83 mln.
-20.44%
1 janv. 2013
38.67 mln.
+4.3 mln.
12.51%
1 janv. 2014
32.09 mln.
-6.58 mln.
-17.02%
1 janv. 2015
44.72 mln.
+12.63 mln.
39.36%
Classement des pays selon les statistiques actuelles par années

Commentaires:

Envoyer
PremiumAbout & FeedbackUn accordConfidentialité
logo
© 2022 Selected Technologies LLC – Morgan Hill, California