33
/fr/
AIzaSyB4mHJ5NPEv-XzF7P6NDYXjlkCWaeKw5bc
November 1, 2025
67805
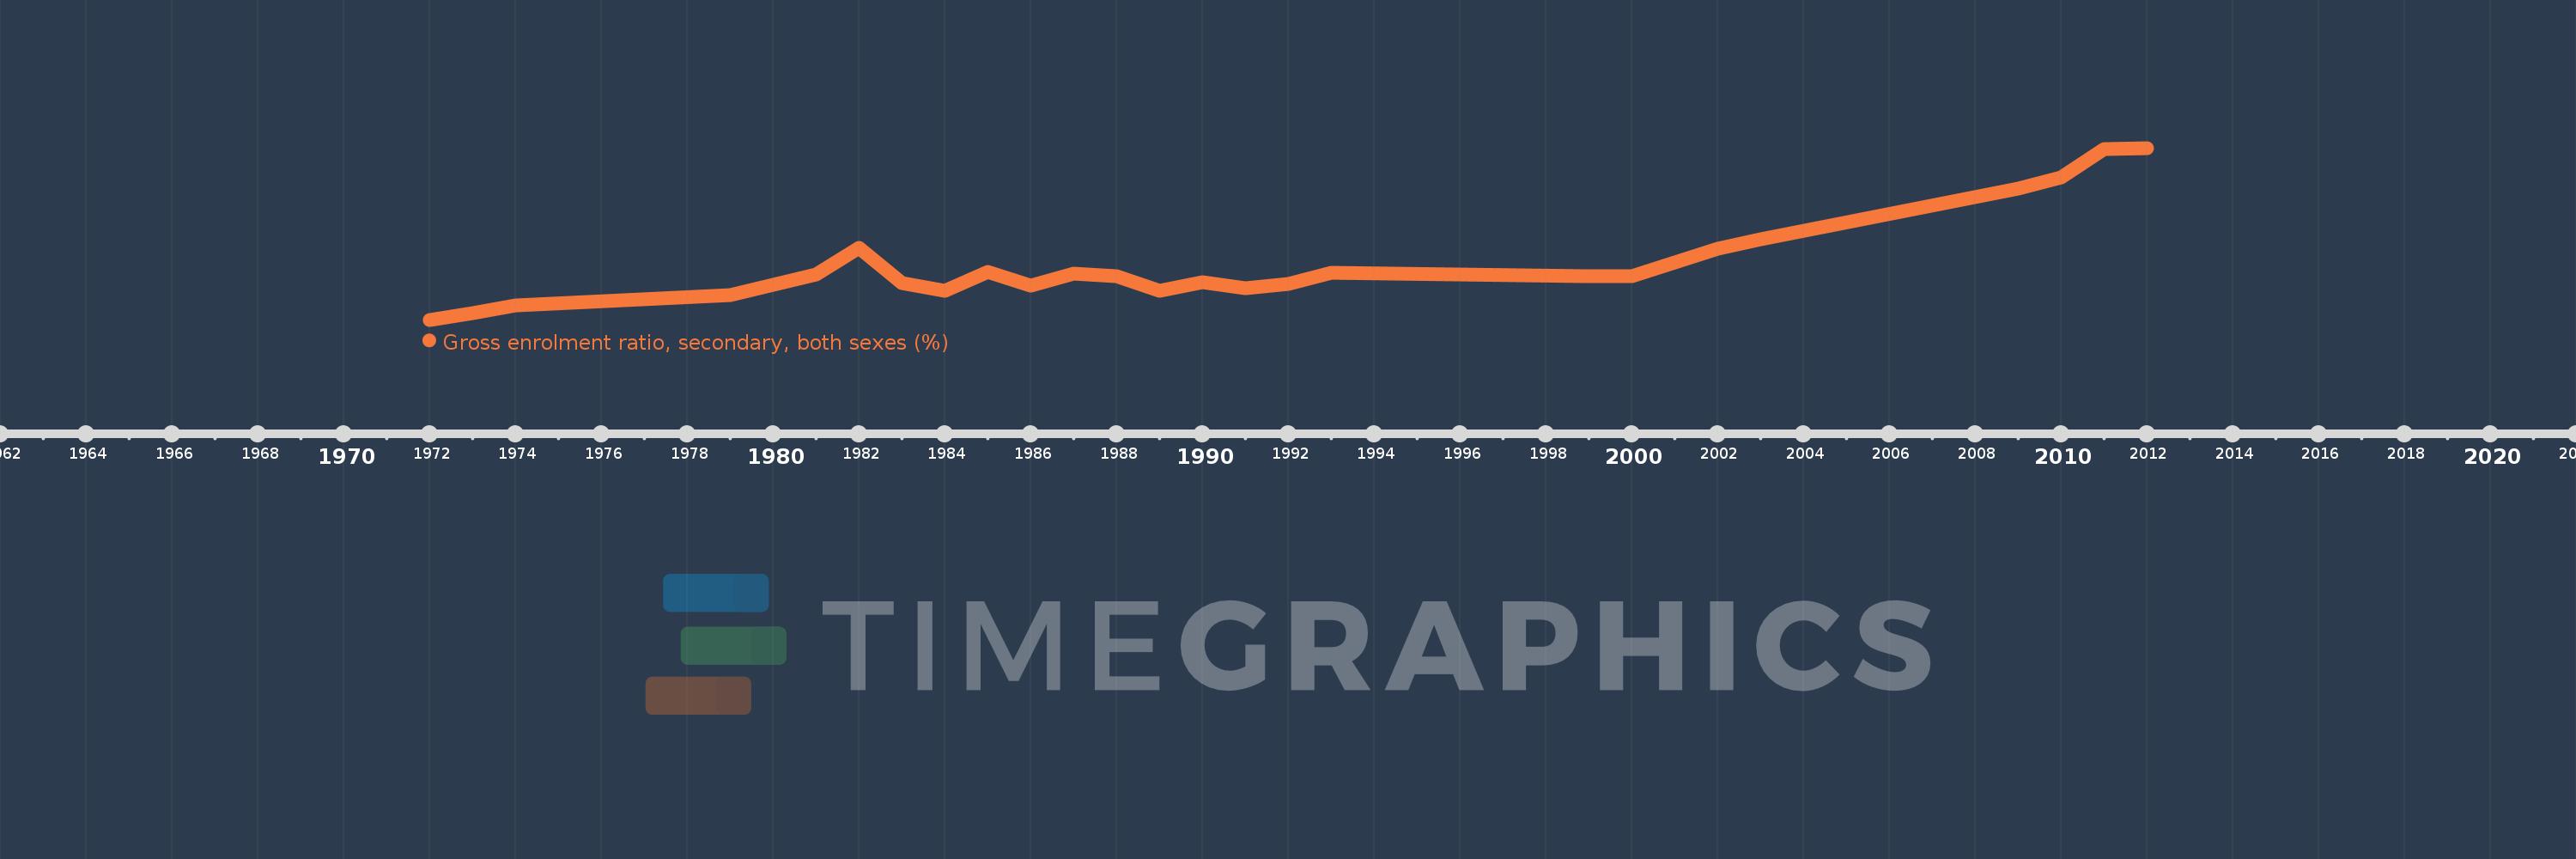
Angola
AGO
true
2
1
Gross enrolment ratio, secondary, both sexes (%)
2012,2011,2010,2009,2003,2002,2001,2000,1999,1993,1992,1991,1990,1989,1988,1987,1986,1985,1984,1983,1982,1981,1979,1974,1973,1972