33
/fr/
AIzaSyB4mHJ5NPEv-XzF7P6NDYXjlkCWaeKw5bc
November 30, 2025
229808
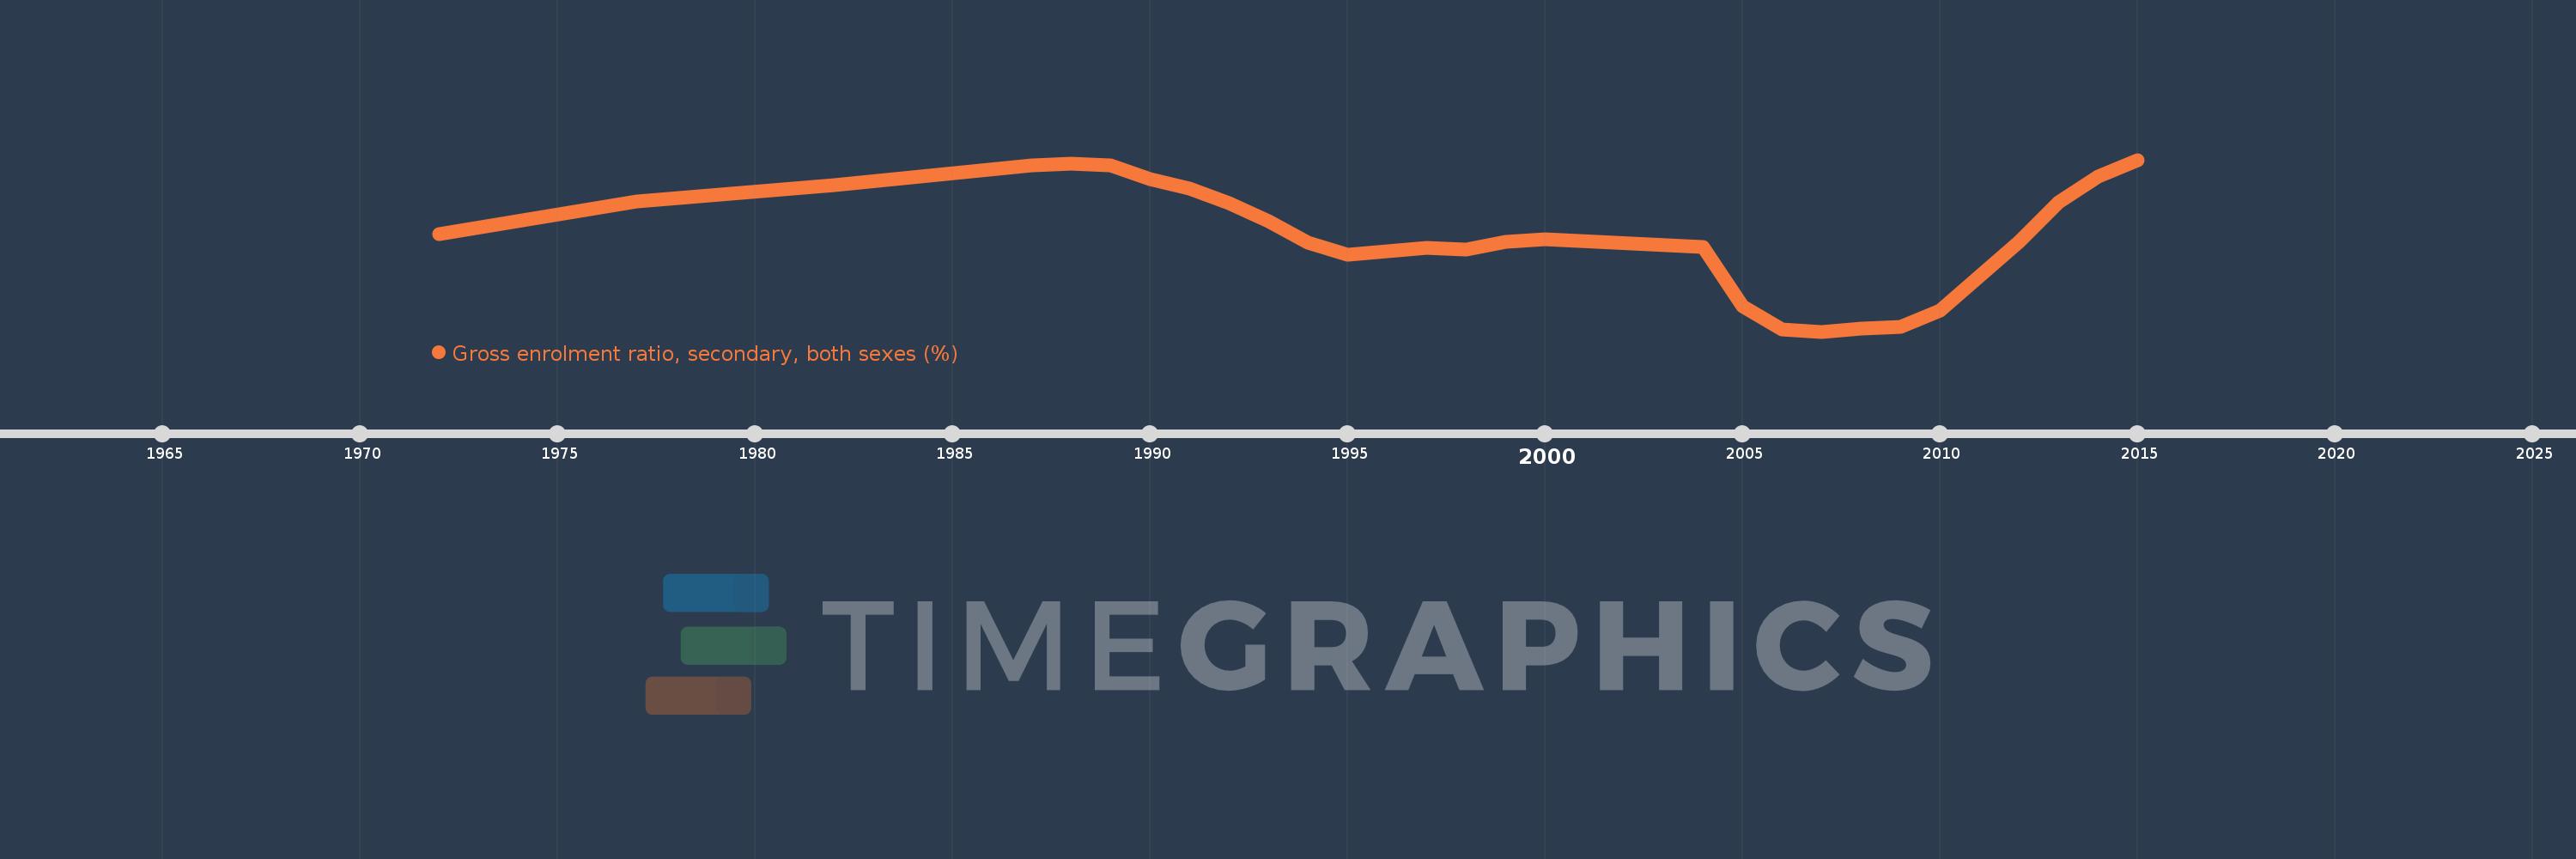
Russian Federation
RUS
true
2
1
Gross enrolment ratio, secondary, both sexes (%)
2015,2014,2013,2012,2010,2009,2008,2007,2006,2005,2004,2000,1999,1998,1997,1996,1995,1994,1993,1992,1991,1990,1989,1988,1987,1982,1977,1972