33
/fr/
AIzaSyB4mHJ5NPEv-XzF7P6NDYXjlkCWaeKw5bc
November 1, 2025
150430
Honduras
HND
true
2
1
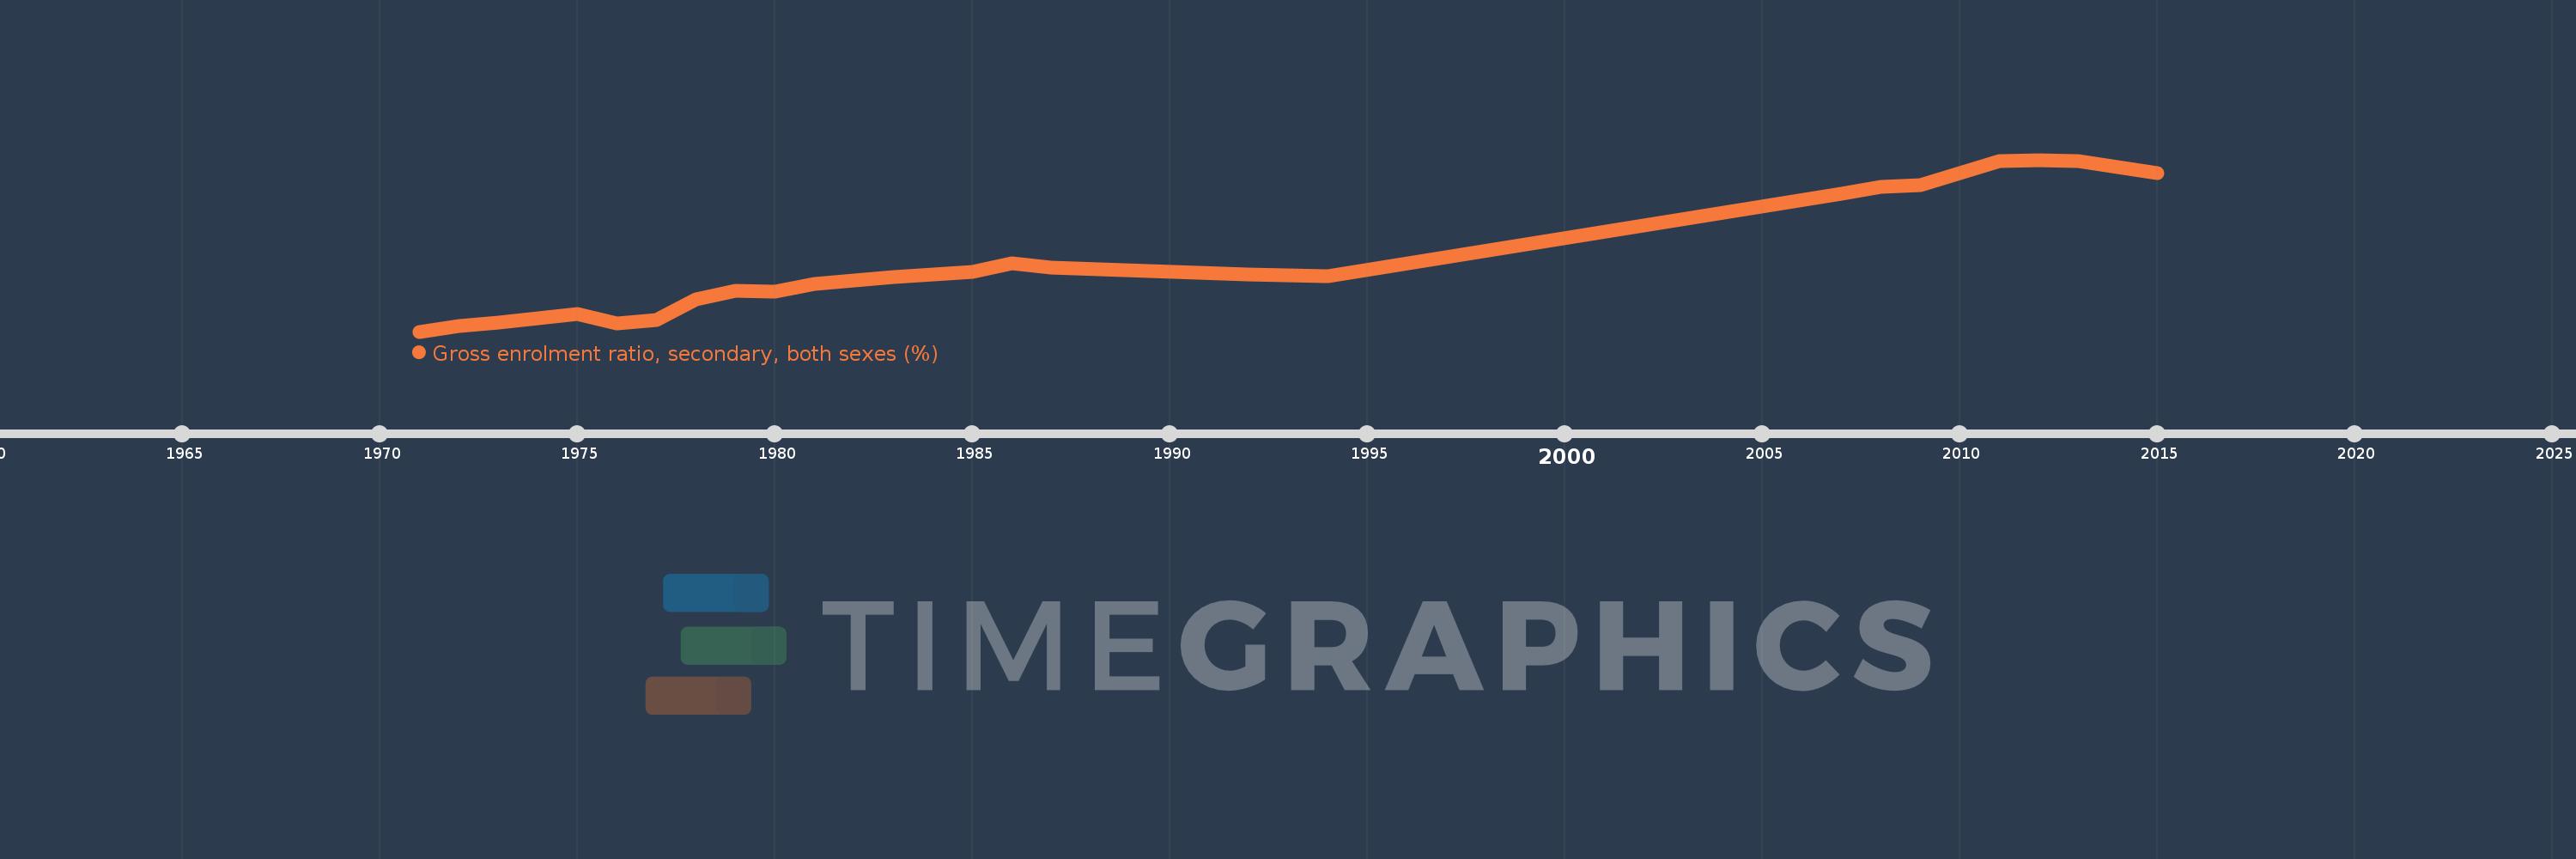
Gross enrolment ratio, secondary, both sexes (%)
2015,2014,2013,2012,2011,2009,2008,2007,1994,1992,1987,1986,1985,1984,1983,1981,1980,1979,1978,1977,1976,1975,1973,1972,1971