33
/fr/
AIzaSyB4mHJ5NPEv-XzF7P6NDYXjlkCWaeKw5bc
November 1, 2025
162613
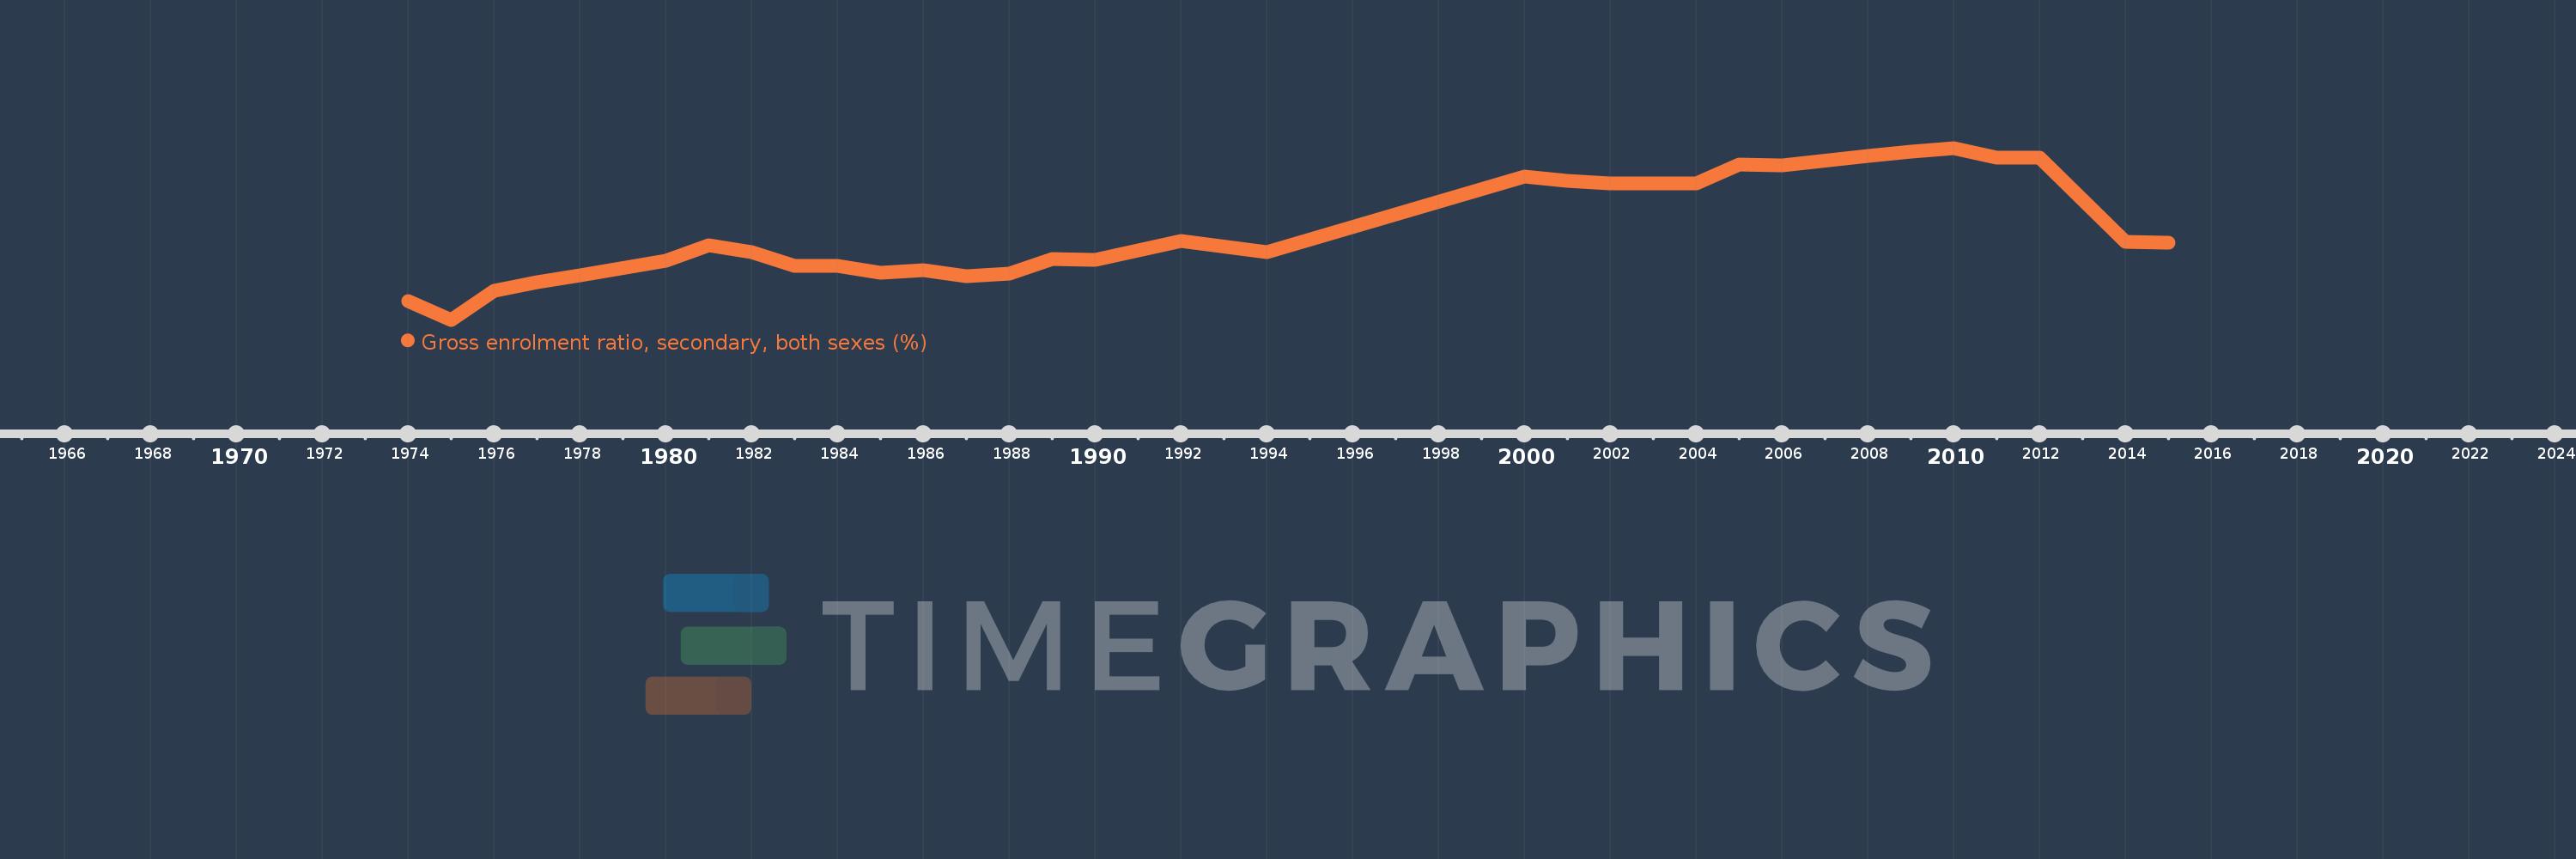
Jamaica
JAM
true
2
1
Gross enrolment ratio, secondary, both sexes (%)
2015,2014,2012,2011,2010,2009,2008,2006,2005,2004,2003,2002,2001,2000,1994,1992,1990,1989,1988,1987,1986,1985,1984,1983,1982,1981,1980,1978,1977,1976,1975,1974