33
/fr/
AIzaSyB4mHJ5NPEv-XzF7P6NDYXjlkCWaeKw5bc
November 1, 2025
255232
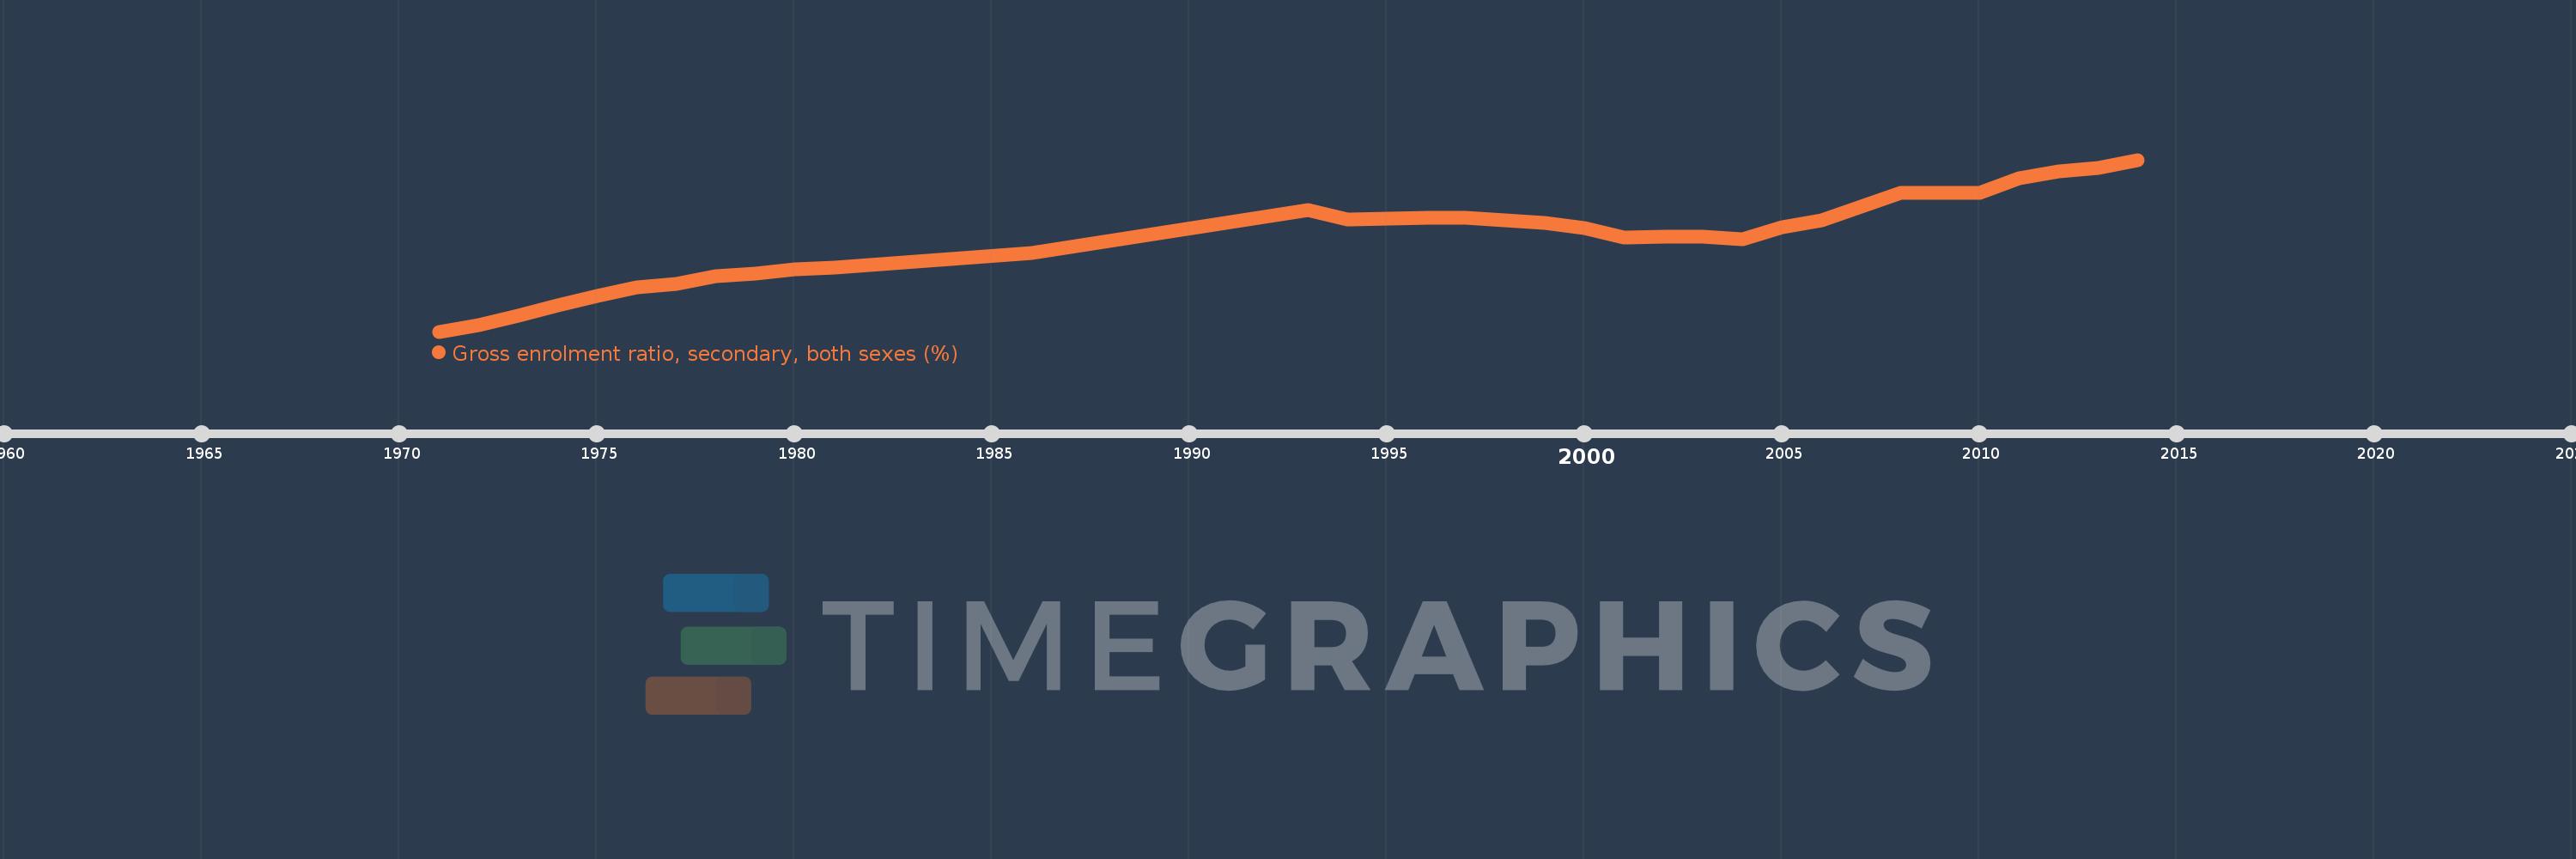
Swaziland
SWZ
true
2
1
Gross enrolment ratio, secondary, both sexes (%)
2014,2013,2012,2011,2010,2008,2007,2006,2005,2004,2003,2002,2001,2000,1999,1997,1996,1995,1994,1993,1986,1981,1980,1979,1978,1977,1976,1975,1974,1973,1972,1971