33
/fr/
AIzaSyAYiBZKx7MnpbEhh9jyipgxe19OcubqV5w
August 1, 2025
62464
World
WLD
false
2
1
Container port traffic (TEU: 20 foot equivalent units)
2015,2014,2013,2012,2011,2010,2009,2008,2007,2006,2005,2004,2003,2002,2001
Download
Bibliothèque de statistiques globales →World →

Container port traffic (TEU: 20 foot equivalent units)

Cette statistique dans les autres pays:

AlbaniaAlgeriaAngolaAntigua and BarbudaArab WorldArgentinaArubaAustraliaAustriaBahamas, TheBahrainBangladeshBarbadosBelgiumBelizeBeninBrazilBrunei DarussalamBulgariaCambodiaCameroonCanadaCaribbean small statesCayman IslandsCentral Europe and the BalticsChileChinaColombiaCongo, Rep.Costa RicaCote d'IvoireCroatiaCubaCyprusDenmarkDjiboutiDominican RepublicEarly-demographic dividendEast Asia & PacificEast Asia & Pacific (excluding high income)East Asia & Pacific (IDA & IBRD countries)EcuadorEgypt, Arab Rep.El SalvadorEstoniaEuro areaEurope & Central AsiaEurope & Central Asia (excluding high income)Europe & Central Asia (IDA & IBRD countries)European UnionFinlandFranceFrench PolynesiaGabonGeorgiaGermanyGhanaGreeceGuamGuatemalaHigh incomeHondurasHong Kong SAR, ChinaIBRD onlyIcelandIDA & IBRD totalIDA blendIndiaIndonesiaIran, Islamic Rep.IrelandIsraelItalyJamaicaJapanJordanKenyaKorea, Rep.KuwaitLate-demographic dividendLatin America & Caribbean Latin America & Caribbean (excluding high income)Latin America & the Caribbean (IDA & IBRD countries)LatviaLebanonLibyaLithuaniaLow & middle incomeLower middle incomeMadagascarMalaysiaMaldivesMaltaMauritaniaMauritiusMexicoMiddle East & North AfricaMiddle East & North Africa (excluding high income)Middle East & North Africa (IDA & IBRD countries)Middle incomeMoroccoMozambiqueMyanmarNamibiaNetherlandsNew CaledoniaNew ZealandNicaraguaNigeriaNorth AmericaNorwayOECD membersOmanPakistanPanamaPapua New GuineaParaguayPeruPhilippinesPolandPortugalPost-demographic dividendPuerto RicoQatarRomaniaRussian FederationSaudi ArabiaSenegalSingaporeSloveniaSouth AfricaSouth AsiaSouth Asia (IDA & IBRD)SpainSri LankaSt. LuciaSt. Vincent and the GrenadinesSudanSwedenSwitzerlandSyrian Arab RepublicTanzaniaThailandTrinidad and TobagoTunisiaTurkeyUkraineUnited Arab EmiratesUnited KingdomUnited StatesUpper middle incomeUruguayVenezuela, RBVietnamWorldYemen, Rep.

La ligne de temps

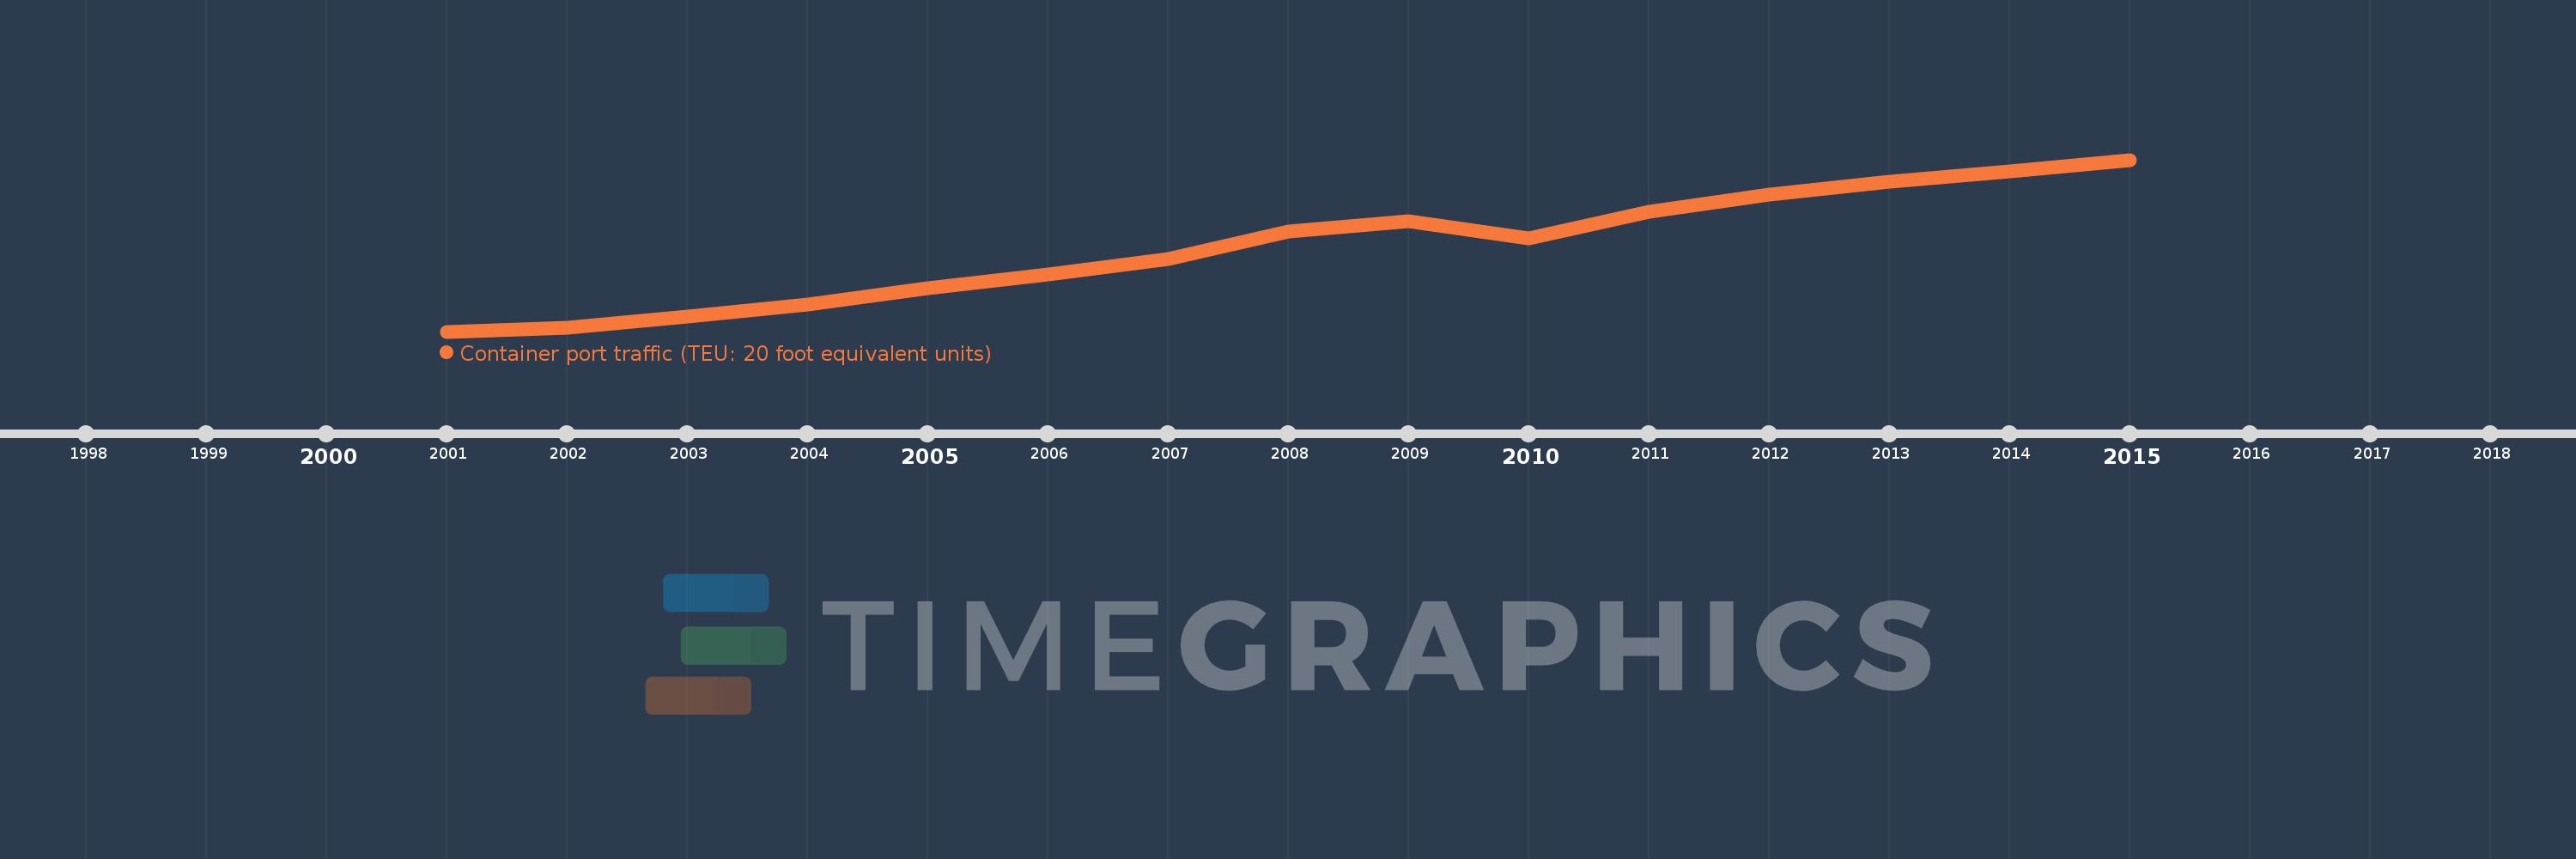
Cette échelle de temps montre un graphique de 2001 année à 2015 année World. Les données jusqu'à 2000 année ne sont pas présentés. Quantité d'observations actuelles selon dates: 15.

Source (désignation):

Les indicateurs du développement mondiale

Source (organisation):

Containerisation International, Containerisation International Yearbook.

Catégories:

Infrastructure

Dernière mise à jour

23 avr. 2017

Les indicateurs de changement de valeurs selon les années

En moyenne:
447.378 mln.
Minimum:
224.775 mln.
1 janv. 2001
Maximum:
679.265 mln.
1 janv. 2015
Pour la date d''observation
Valeur
Changement absolu
Le changement par rapport à la valeur précédente
1 janv. 2001
224.775 mln.
+224.775 mln.
0.0%
1 janv. 2002
235.075 mln.
+10.301 mln.
4.58%
1 janv. 2003
263.457 mln.
+28.381 mln.
12.07%
1 janv. 2004
296.996 mln.
+33.54 mln.
12.73%
1 janv. 2005
338.434 mln.
+41.438 mln.
13.95%
1 janv. 2006
376.268 mln.
+37.834 mln.
11.18%
1 janv. 2007
416.752 mln.
+40.484 mln.
10.76%
1 janv. 2008
489.818 mln.
+73.066 mln.
17.53%
1 janv. 2009
516.152 mln.
+26.334 mln.
5.38%
1 janv. 2010
472.175 mln.
-43.977 mln.
-8.52%
1 janv. 2011
542.248 mln.
+70.073 mln.
14.84%
1 janv. 2012
587.483 mln.
+45.235 mln.
8.34%
1 janv. 2013
622.314 mln.
+34.83 mln.
5.93%
1 janv. 2014
649.454 mln.
+27.14 mln.
4.36%
1 janv. 2015
679.265 mln.
+29.811 mln.
4.59%

Classement des pays selon les statistiques actuelles par années