29
/fr/
fr
AIzaSyAYiBZKx7MnpbEhh9jyipgxe19OcubqV5w
April 1, 2024
274620
United Arab Emirates
ARE
true
2
1
Container port traffic (TEU: 20 foot equivalent units)
2015,2014,2013,2012,2011,2010,2009,2008,2007,2006,2005,2004,2003,2002,2001
Download
Bibliothèque de statistiques globales →United Arab Emirates →

Container port traffic (TEU: 20 foot equivalent units)

Cette statistique dans les autres pays:
AlbaniaAlgeriaAngolaAntigua and BarbudaArab WorldArgentinaArubaAustraliaAustriaBahamas, TheBahrainBangladeshBarbadosBelgiumBelizeBeninBrazilBrunei DarussalamBulgariaCambodiaCameroonCanadaCaribbean small statesCayman IslandsCentral Europe and the BalticsChileChinaColombiaCongo, Rep.Costa RicaCote d'IvoireCroatiaCubaCyprusDenmarkDjiboutiDominican RepublicEarly-demographic dividendEast Asia & PacificEast Asia & Pacific (excluding high income)East Asia & Pacific (IDA & IBRD countries)EcuadorEgypt, Arab Rep.El SalvadorEstoniaEuro areaEurope & Central AsiaEurope & Central Asia (excluding high income)Europe & Central Asia (IDA & IBRD countries)European UnionFinlandFranceFrench PolynesiaGabonGeorgiaGermanyGhanaGreeceGuamGuatemalaHigh incomeHondurasHong Kong SAR, ChinaIBRD onlyIcelandIDA & IBRD totalIDA blendIndiaIndonesiaIran, Islamic Rep.IrelandIsraelItalyJamaicaJapanJordanKenyaKorea, Rep.KuwaitLate-demographic dividendLatin America & Caribbean Latin America & Caribbean (excluding high income)Latin America & the Caribbean (IDA & IBRD countries)LatviaLebanonLibyaLithuaniaLow & middle incomeLower middle incomeMadagascarMalaysiaMaldivesMaltaMauritaniaMauritiusMexicoMiddle East & North AfricaMiddle East & North Africa (excluding high income)Middle East & North Africa (IDA & IBRD countries)Middle incomeMoroccoMozambiqueMyanmarNamibiaNetherlandsNew CaledoniaNew ZealandNicaraguaNigeriaNorth AmericaNorwayOECD membersOmanPakistanPanamaPapua New GuineaParaguayPeruPhilippinesPolandPortugalPost-demographic dividendPuerto RicoQatarRomaniaRussian FederationSaudi ArabiaSenegalSingaporeSloveniaSouth AfricaSouth AsiaSouth Asia (IDA & IBRD)SpainSri LankaSt. LuciaSt. Vincent and the GrenadinesSudanSwedenSwitzerlandSyrian Arab RepublicTanzaniaThailandTrinidad and TobagoTunisiaTurkeyUkraineUnited Arab EmiratesUnited KingdomUnited StatesUpper middle incomeUruguayVenezuela, RBVietnamWorldYemen, Rep.
La ligne de temps
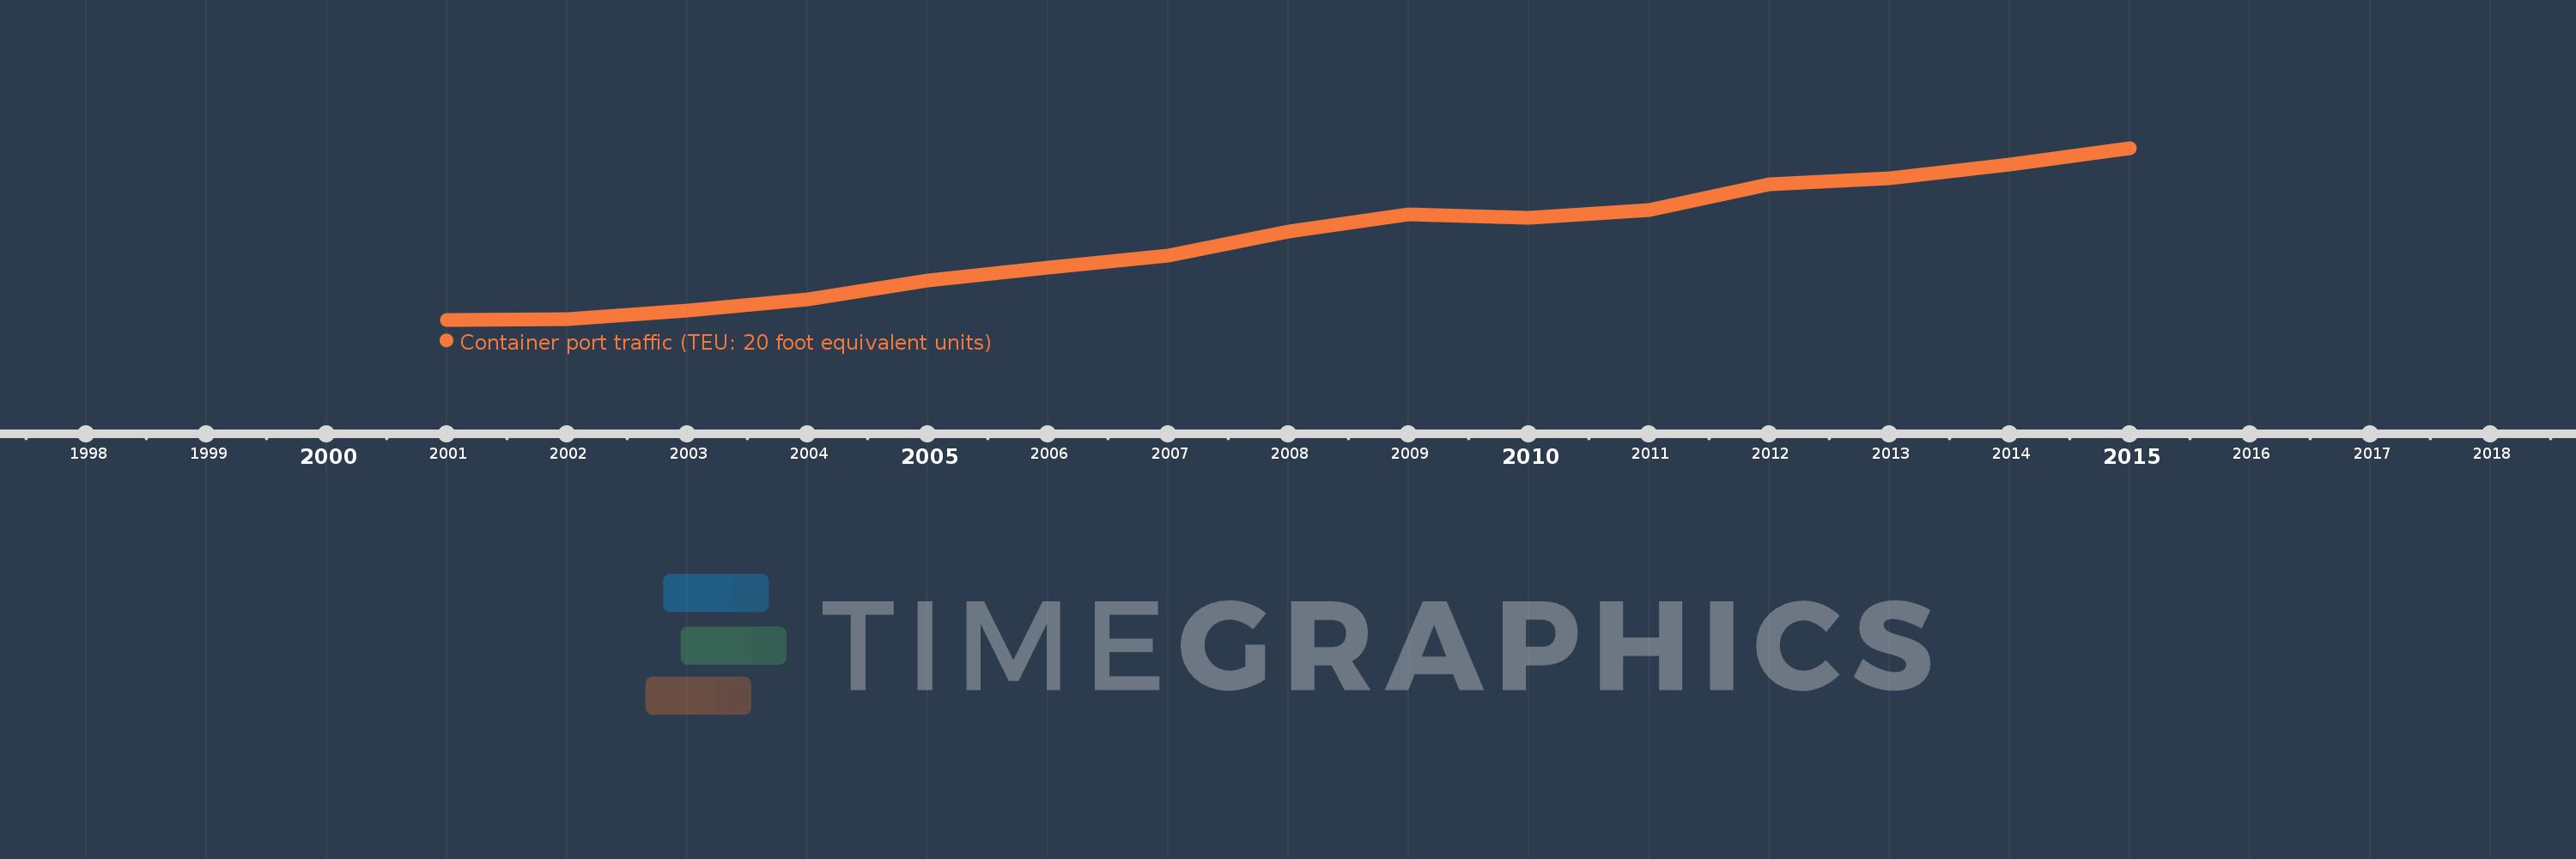
Cette échelle de temps montre un graphique de 2001 année à 2015 année United Arab Emirates. Les données jusqu'à 2000 année ne sont pas présentés. Quantité d'observations actuelles selon dates: 15.
Source (désignation):
Les indicateurs du développement mondiale
Source (organisation):
Containerisation International, Containerisation International Yearbook.
Catégories:
Infrastructure
Dernière mise à jour
23 avr. 2017
Les indicateurs de changement de valeurs selon les années
En moyenne:
12.393 mln.
Minimum:
5.056 mln.
1 janv. 2001
Maximum:
20.901 mln.
1 janv. 2015
Pour la date d''observation
Valeur
Changement absolu
Le changement par rapport à la valeur précédente
1 janv. 2001
5.056 mln.
+5.056 mln.
0.0%
1 janv. 2002
5.082 mln.
+26.163 milles
0.52%
1 janv. 2003
5.872 mln.
+790.276 milles
15.55%
1 janv. 2004
6.955 mln.
+1.083 mln.
18.44%
1 janv. 2005
8.662 mln.
+1.706 mln.
24.53%
1 janv. 2006
9.852 mln.
+1.19 mln.
13.74%
1 janv. 2007
10.967 mln.
+1.115 mln.
11.32%
1 janv. 2008
13.182 mln.
+2.215 mln.
20.2%
1 janv. 2009
14.756 mln.
+1.574 mln.
11.94%
1 janv. 2010
14.425 mln.
-331.088 milles
-2.24%
1 janv. 2011
15.177 mln.
+751.485 milles
5.21%
1 janv. 2012
17.548 mln.
+2.372 mln.
15.63%
1 janv. 2013
18.121 mln.
+572.829 milles
3.26%
1 janv. 2014
19.336 mln.
+1.216 mln.
6.71%
1 janv. 2015
20.901 mln.
+1.564 mln.
8.09%
Classement des pays selon les statistiques actuelles par années

Commentaires:

Envoyer
PremiumAbout & FeedbackUn accordConfidentialité
logo
© 2022 Selected Technologies LLC – Morgan Hill, California