29
/fr/
fr
AIzaSyAYiBZKx7MnpbEhh9jyipgxe19OcubqV5w
April 1, 2024
44918
Low & middle income
LMY
false
2
1
Container port traffic (TEU: 20 foot equivalent units)
2015,2014,2013,2012,2011,2010,2009,2008,2007,2006,2005,2004,2003,2002,2001
Download
Bibliothèque de statistiques globales →Low & middle income →

Container port traffic (TEU: 20 foot equivalent units)

Cette statistique dans les autres pays:
AlbaniaAlgeriaAngolaAntigua and BarbudaArab WorldArgentinaArubaAustraliaAustriaBahamas, TheBahrainBangladeshBarbadosBelgiumBelizeBeninBrazilBrunei DarussalamBulgariaCambodiaCameroonCanadaCaribbean small statesCayman IslandsCentral Europe and the BalticsChileChinaColombiaCongo, Rep.Costa RicaCote d'IvoireCroatiaCubaCyprusDenmarkDjiboutiDominican RepublicEarly-demographic dividendEast Asia & PacificEast Asia & Pacific (excluding high income)East Asia & Pacific (IDA & IBRD countries)EcuadorEgypt, Arab Rep.El SalvadorEstoniaEuro areaEurope & Central AsiaEurope & Central Asia (excluding high income)Europe & Central Asia (IDA & IBRD countries)European UnionFinlandFranceFrench PolynesiaGabonGeorgiaGermanyGhanaGreeceGuamGuatemalaHigh incomeHondurasHong Kong SAR, ChinaIBRD onlyIcelandIDA & IBRD totalIDA blendIndiaIndonesiaIran, Islamic Rep.IrelandIsraelItalyJamaicaJapanJordanKenyaKorea, Rep.KuwaitLate-demographic dividendLatin America & Caribbean Latin America & Caribbean (excluding high income)Latin America & the Caribbean (IDA & IBRD countries)LatviaLebanonLibyaLithuaniaLow & middle incomeLower middle incomeMadagascarMalaysiaMaldivesMaltaMauritaniaMauritiusMexicoMiddle East & North AfricaMiddle East & North Africa (excluding high income)Middle East & North Africa (IDA & IBRD countries)Middle incomeMoroccoMozambiqueMyanmarNamibiaNetherlandsNew CaledoniaNew ZealandNicaraguaNigeriaNorth AmericaNorwayOECD membersOmanPakistanPanamaPapua New GuineaParaguayPeruPhilippinesPolandPortugalPost-demographic dividendPuerto RicoQatarRomaniaRussian FederationSaudi ArabiaSenegalSingaporeSloveniaSouth AfricaSouth AsiaSouth Asia (IDA & IBRD)SpainSri LankaSt. LuciaSt. Vincent and the GrenadinesSudanSwedenSwitzerlandSyrian Arab RepublicTanzaniaThailandTrinidad and TobagoTunisiaTurkeyUkraineUnited Arab EmiratesUnited KingdomUnited StatesUpper middle incomeUruguayVenezuela, RBVietnamWorldYemen, Rep.
La ligne de temps
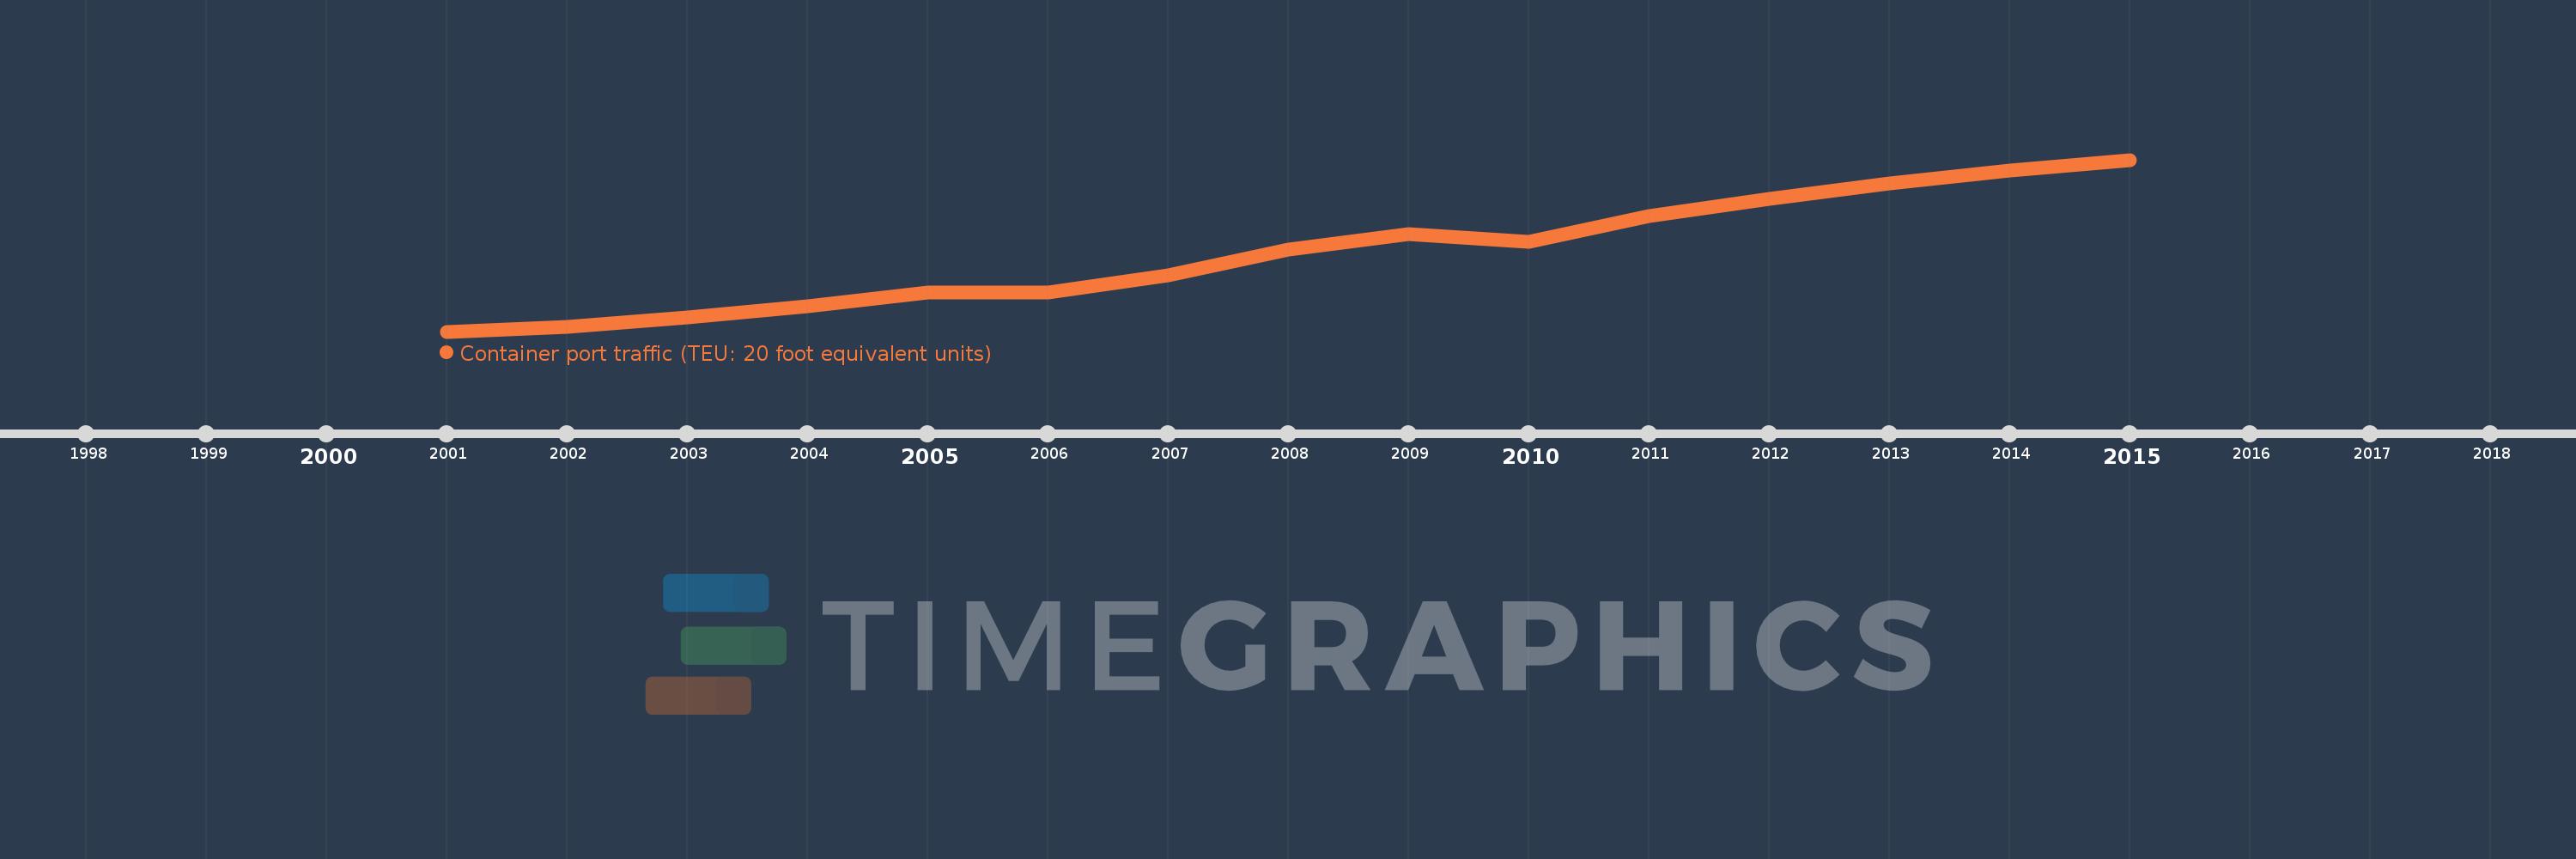
Cette échelle de temps montre un graphique de 2001 année à 2015 année Low & middle income. Les données jusqu'à 2000 année ne sont pas présentés. Quantité d'observations actuelles selon dates: 15.
Source (désignation):
Les indicateurs du développement mondiale
Source (organisation):
Containerisation International, Containerisation International Yearbook.
Catégories:
Infrastructure
Dernière mise à jour
23 avr. 2017
Les indicateurs de changement de valeurs selon les années
En moyenne:
203.416 mln.
Minimum:
80.518 mln.
1 janv. 2001
Maximum:
349.572 mln.
1 janv. 2015
Pour la date d''observation
Valeur
Changement absolu
Le changement par rapport à la valeur précédente
1 janv. 2001
80.518 mln.
+80.518 mln.
0.0%
1 janv. 2002
88.161 mln.
+7.642 mln.
9.49%
1 janv. 2003
103.366 mln.
+15.206 mln.
17.25%
1 janv. 2004
119.806 mln.
+16.439 mln.
15.9%
1 janv. 2005
142.319 mln.
+22.513 mln.
18.79%
1 janv. 2006
141.745 mln.
-573.401 milles
-0.4%
1 janv. 2007
168.138 mln.
+26.393 mln.
18.62%
1 janv. 2008
208.654 mln.
+40.516 mln.
24.1%
1 janv. 2009
233.155 mln.
+24.502 mln.
11.74%
1 janv. 2010
220.933 mln.
-12.223 mln.
-5.24%
1 janv. 2011
260.854 mln.
+39.921 mln.
18.07%
1 janv. 2012
288.439 mln.
+27.586 mln.
10.58%
1 janv. 2013
312.936 mln.
+24.497 mln.
8.49%
1 janv. 2014
332.648 mln.
+19.712 mln.
6.3%
1 janv. 2015
349.572 mln.
+16.924 mln.
5.09%
Classement des pays selon les statistiques actuelles par années

Commentaires:

Envoyer
PremiumAbout & FeedbackUn accordConfidentialité
logo
© 2022 Selected Technologies LLC – Morgan Hill, California