30
/fr/
AIzaSyAYiBZKx7MnpbEhh9jyipgxe19OcubqV5w
April 1, 2024
30538
Europe & Central Asia
ECS
false
2
1
Container port traffic (TEU: 20 foot equivalent units)
2015,2014,2013,2012,2011,2010,2009,2008,2007,2006,2005,2004,2003,2002,2001
Download
Bibliothèque de statistiques globales →Europe & Central Asia →

Container port traffic (TEU: 20 foot equivalent units)

Cette statistique dans les autres pays:

AlbaniaAlgeriaAngolaAntigua and BarbudaArab WorldArgentinaArubaAustraliaAustriaBahamas, TheBahrainBangladeshBarbadosBelgiumBelizeBeninBrazilBrunei DarussalamBulgariaCambodiaCameroonCanadaCaribbean small statesCayman IslandsCentral Europe and the BalticsChileChinaColombiaCongo, Rep.Costa RicaCote d'IvoireCroatiaCubaCyprusDenmarkDjiboutiDominican RepublicEarly-demographic dividendEast Asia & PacificEast Asia & Pacific (excluding high income)East Asia & Pacific (IDA & IBRD countries)EcuadorEgypt, Arab Rep.El SalvadorEstoniaEuro areaEurope & Central AsiaEurope & Central Asia (excluding high income)Europe & Central Asia (IDA & IBRD countries)European UnionFinlandFranceFrench PolynesiaGabonGeorgiaGermanyGhanaGreeceGuamGuatemalaHigh incomeHondurasHong Kong SAR, ChinaIBRD onlyIcelandIDA & IBRD totalIDA blendIndiaIndonesiaIran, Islamic Rep.IrelandIsraelItalyJamaicaJapanJordanKenyaKorea, Rep.KuwaitLate-demographic dividendLatin America & Caribbean Latin America & Caribbean (excluding high income)Latin America & the Caribbean (IDA & IBRD countries)LatviaLebanonLibyaLithuaniaLow & middle incomeLower middle incomeMadagascarMalaysiaMaldivesMaltaMauritaniaMauritiusMexicoMiddle East & North AfricaMiddle East & North Africa (excluding high income)Middle East & North Africa (IDA & IBRD countries)Middle incomeMoroccoMozambiqueMyanmarNamibiaNetherlandsNew CaledoniaNew ZealandNicaraguaNigeriaNorth AmericaNorwayOECD membersOmanPakistanPanamaPapua New GuineaParaguayPeruPhilippinesPolandPortugalPost-demographic dividendPuerto RicoQatarRomaniaRussian FederationSaudi ArabiaSenegalSingaporeSloveniaSouth AfricaSouth AsiaSouth Asia (IDA & IBRD)SpainSri LankaSt. LuciaSt. Vincent and the GrenadinesSudanSwedenSwitzerlandSyrian Arab RepublicTanzaniaThailandTrinidad and TobagoTunisiaTurkeyUkraineUnited Arab EmiratesUnited KingdomUnited StatesUpper middle incomeUruguayVenezuela, RBVietnamWorldYemen, Rep.

La ligne de temps

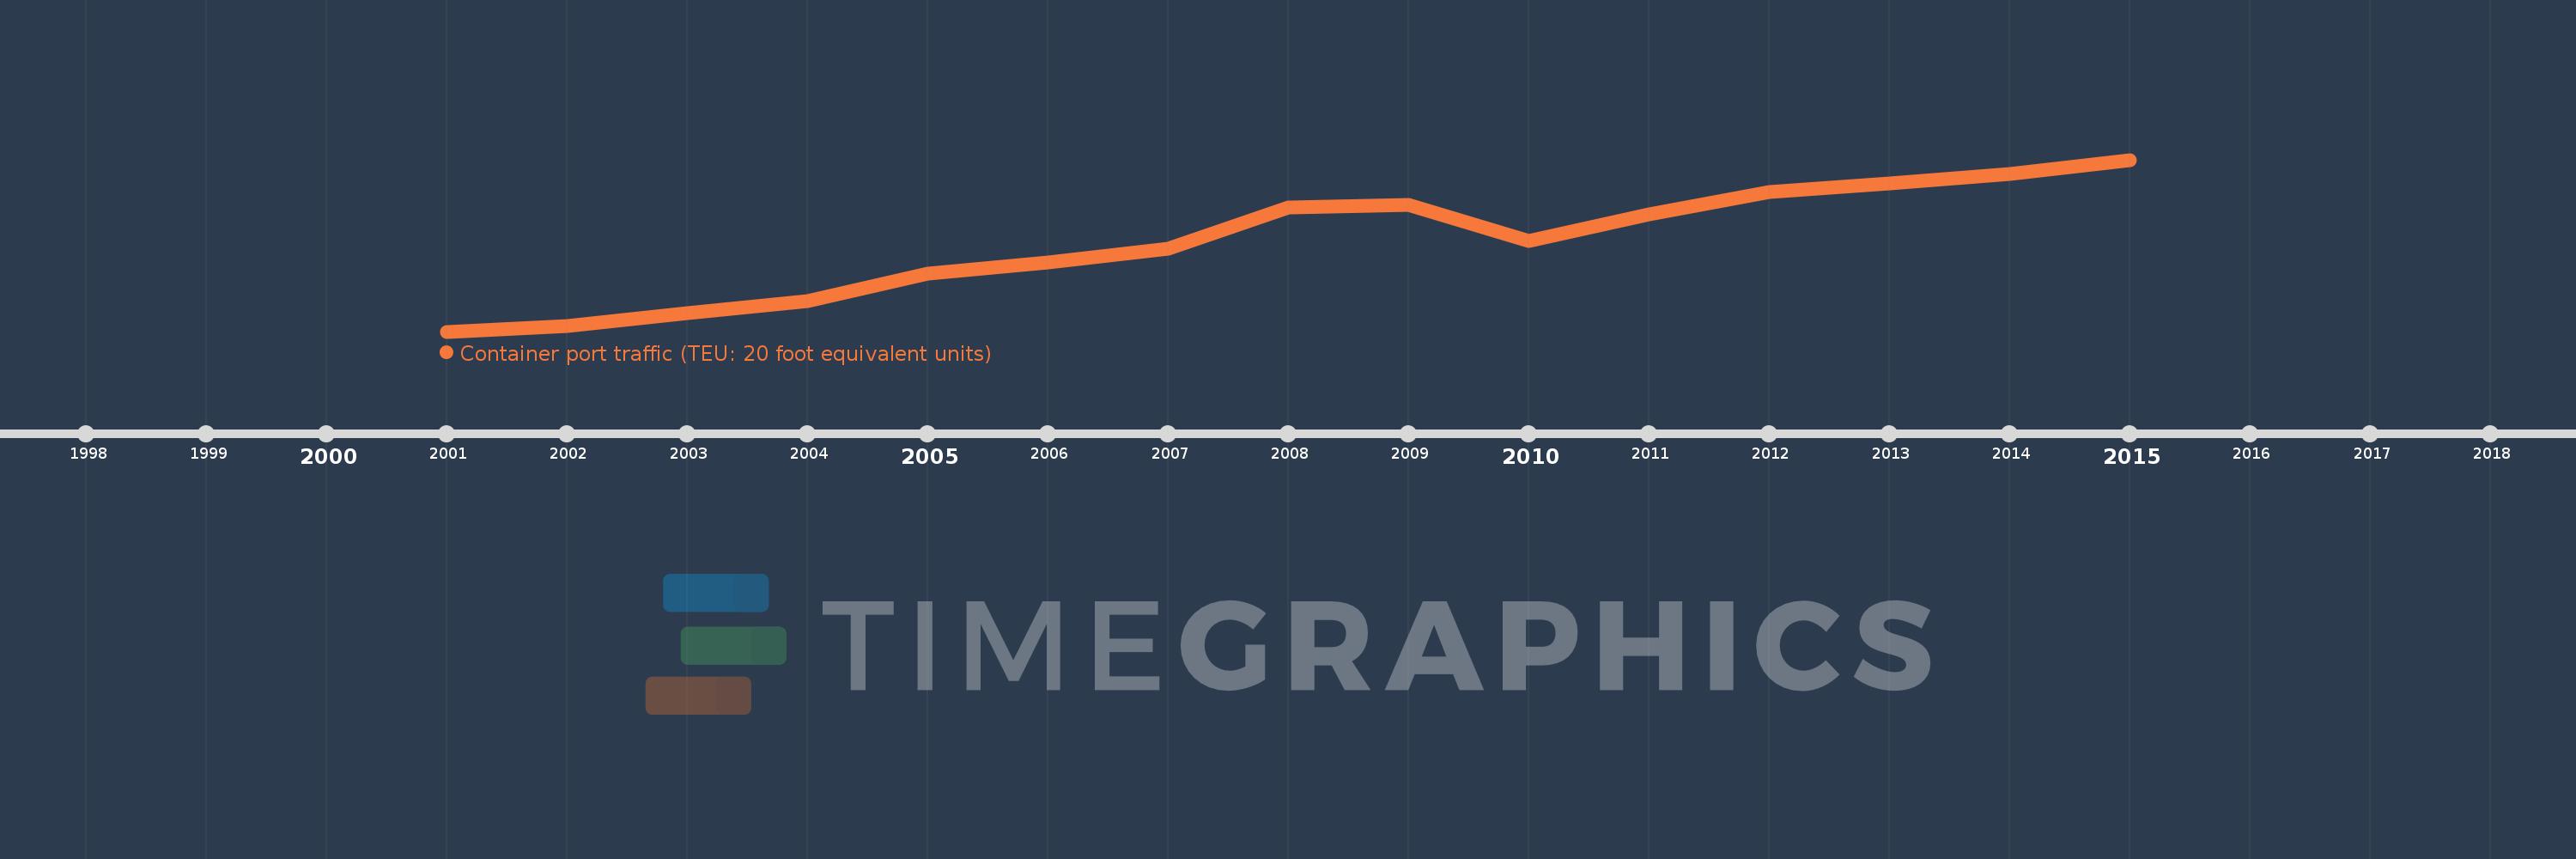
Cette échelle de temps montre un graphique de 2001 année à 2015 année Europe & Central Asia. Les données jusqu'à 2000 année ne sont pas présentés. Quantité d'observations actuelles selon dates: 15.

Source (désignation):

Les indicateurs du développement mondiale

Source (organisation):

Containerisation International, Containerisation International Yearbook.

Catégories:

Infrastructure

Dernière mise à jour

23 avr. 2017

Les indicateurs de changement de valeurs selon les années

En moyenne:
83.76 mln.
Minimum:
48.312 mln.
1 janv. 2001
Maximum:
116.401 mln.
1 janv. 2015
Pour la date d''observation
Valeur
Changement absolu
Le changement par rapport à la valeur précédente
1 janv. 2001
48.312 mln.
+48.312 mln.
0.0%
1 janv. 2002
50.66 mln.
+2.348 mln.
4.86%
1 janv. 2003
55.629 mln.
+4.969 mln.
9.81%
1 janv. 2004
60.322 mln.
+4.693 mln.
8.44%
1 janv. 2005
71.19 mln.
+10.868 mln.
18.02%
1 janv. 2006
75.798 mln.
+4.608 mln.
6.47%
1 janv. 2007
81.292 mln.
+5.493 mln.
7.25%
1 janv. 2008
97.542 mln.
+16.251 mln.
19.99%
1 janv. 2009
98.52 mln.
+978.046 milles
1.0%
1 janv. 2010
84.176 mln.
-14.344 mln.
-14.56%
1 janv. 2011
94.758 mln.
+10.582 mln.
12.57%
1 janv. 2012
103.744 mln.
+8.985 mln.
9.48%
1 janv. 2013
107.175 mln.
+3.431 mln.
3.31%
1 janv. 2014
110.881 mln.
+3.706 mln.
3.46%
1 janv. 2015
116.401 mln.
+5.52 mln.
4.98%

Classement des pays selon les statistiques actuelles par années