29
/fr/
fr
AIzaSyAYiBZKx7MnpbEhh9jyipgxe19OcubqV5w
April 1, 2024
35617
High income
HIC
false
2
1
Container port traffic (TEU: 20 foot equivalent units)
2015,2014,2013,2012,2011,2010,2009,2008,2007,2006,2005,2004,2003,2002,2001
Download
Bibliothèque de statistiques globales →High income →

Container port traffic (TEU: 20 foot equivalent units)

Cette statistique dans les autres pays:
AlbaniaAlgeriaAngolaAntigua and BarbudaArab WorldArgentinaArubaAustraliaAustriaBahamas, TheBahrainBangladeshBarbadosBelgiumBelizeBeninBrazilBrunei DarussalamBulgariaCambodiaCameroonCanadaCaribbean small statesCayman IslandsCentral Europe and the BalticsChileChinaColombiaCongo, Rep.Costa RicaCote d'IvoireCroatiaCubaCyprusDenmarkDjiboutiDominican RepublicEarly-demographic dividendEast Asia & PacificEast Asia & Pacific (excluding high income)East Asia & Pacific (IDA & IBRD countries)EcuadorEgypt, Arab Rep.El SalvadorEstoniaEuro areaEurope & Central AsiaEurope & Central Asia (excluding high income)Europe & Central Asia (IDA & IBRD countries)European UnionFinlandFranceFrench PolynesiaGabonGeorgiaGermanyGhanaGreeceGuamGuatemalaHigh incomeHondurasHong Kong SAR, ChinaIBRD onlyIcelandIDA & IBRD totalIDA blendIndiaIndonesiaIran, Islamic Rep.IrelandIsraelItalyJamaicaJapanJordanKenyaKorea, Rep.KuwaitLate-demographic dividendLatin America & Caribbean Latin America & Caribbean (excluding high income)Latin America & the Caribbean (IDA & IBRD countries)LatviaLebanonLibyaLithuaniaLow & middle incomeLower middle incomeMadagascarMalaysiaMaldivesMaltaMauritaniaMauritiusMexicoMiddle East & North AfricaMiddle East & North Africa (excluding high income)Middle East & North Africa (IDA & IBRD countries)Middle incomeMoroccoMozambiqueMyanmarNamibiaNetherlandsNew CaledoniaNew ZealandNicaraguaNigeriaNorth AmericaNorwayOECD membersOmanPakistanPanamaPapua New GuineaParaguayPeruPhilippinesPolandPortugalPost-demographic dividendPuerto RicoQatarRomaniaRussian FederationSaudi ArabiaSenegalSingaporeSloveniaSouth AfricaSouth AsiaSouth Asia (IDA & IBRD)SpainSri LankaSt. LuciaSt. Vincent and the GrenadinesSudanSwedenSwitzerlandSyrian Arab RepublicTanzaniaThailandTrinidad and TobagoTunisiaTurkeyUkraineUnited Arab EmiratesUnited KingdomUnited StatesUpper middle incomeUruguayVenezuela, RBVietnamWorldYemen, Rep.
La ligne de temps
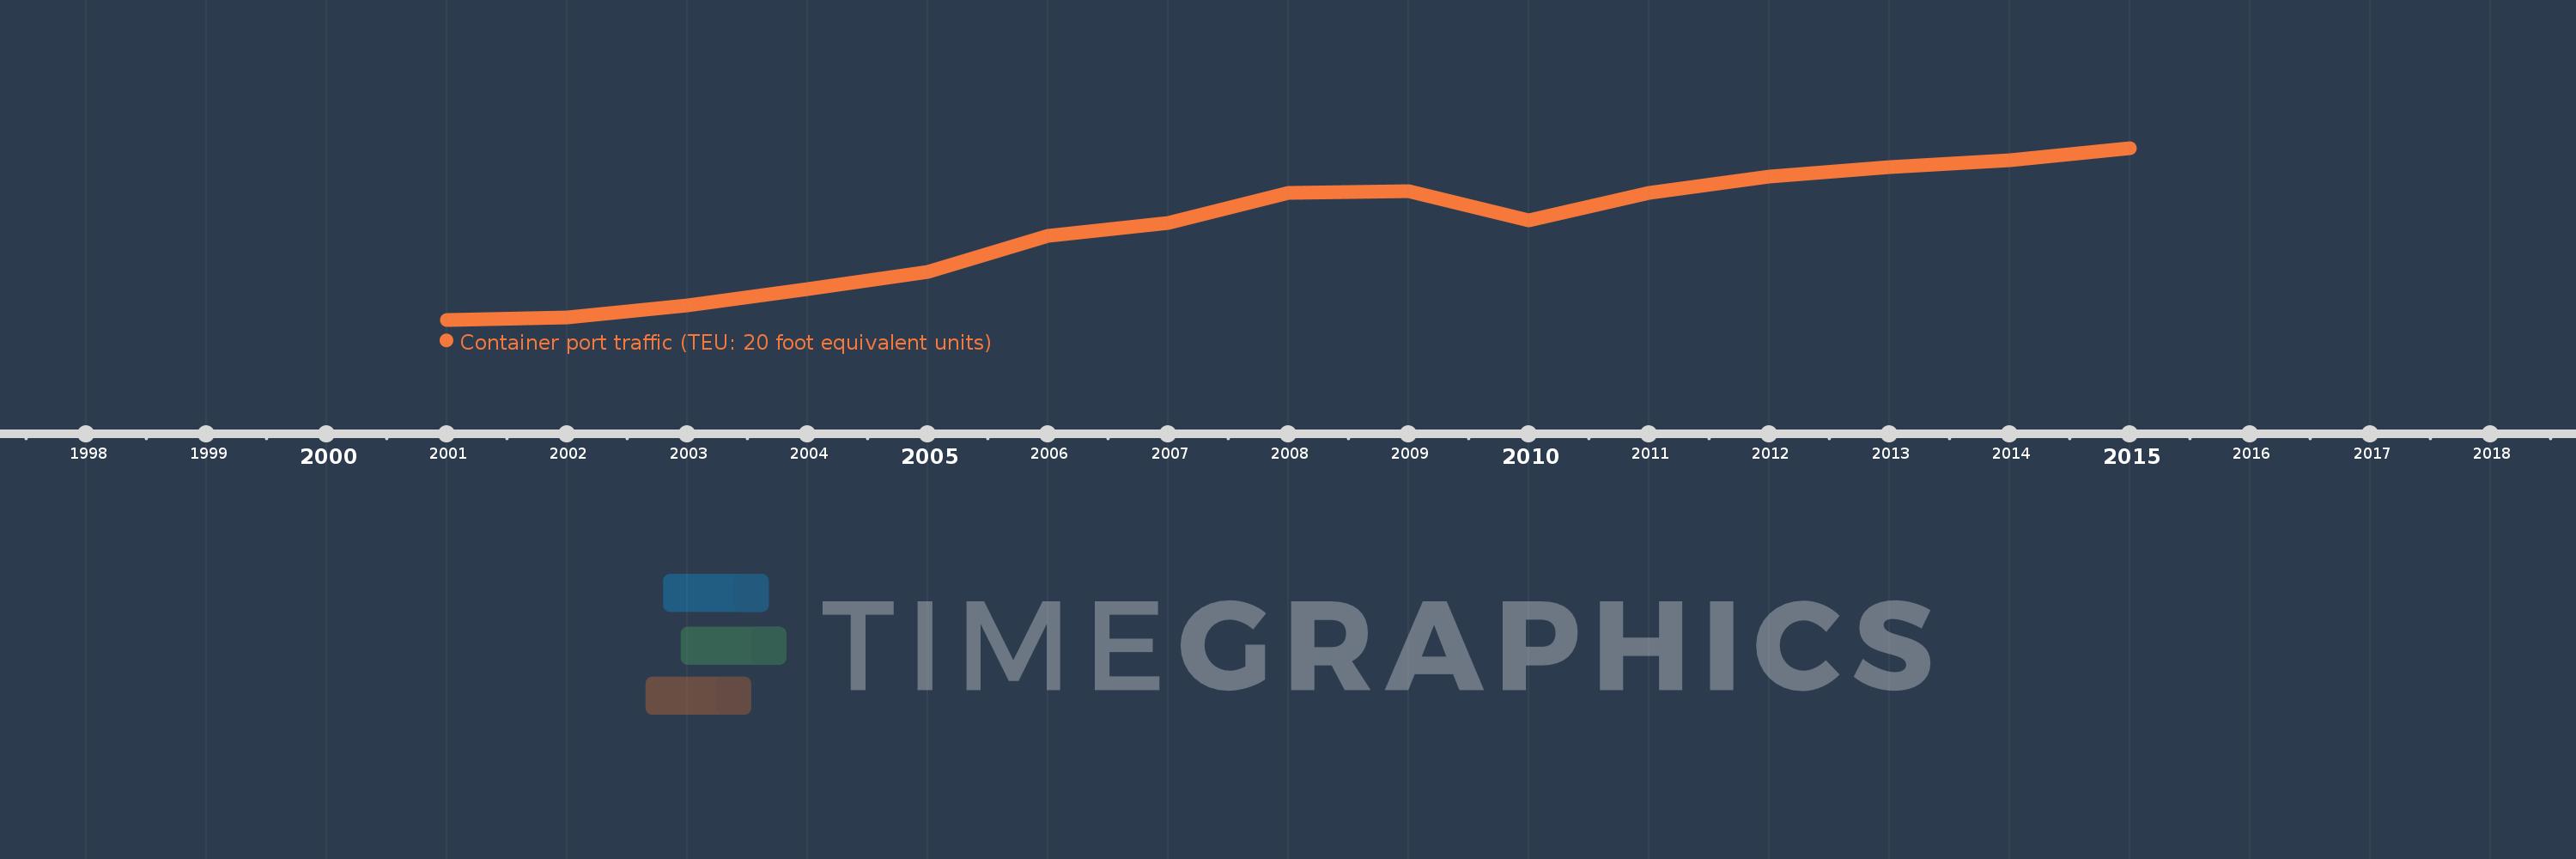
Cette échelle de temps montre un graphique de 2001 année à 2015 année High income. Les données jusqu'à 2000 année ne sont pas présentés. Quantité d'observations actuelles selon dates: 15.
Source (désignation):
Les indicateurs du développement mondiale
Source (organisation):
Containerisation International, Containerisation International Yearbook.
Catégories:
Infrastructure
Dernière mise à jour
23 avr. 2017
Les indicateurs de changement de valeurs selon les années
En moyenne:
243.961 mln.
Minimum:
144.256 mln.
1 janv. 2001
Maximum:
329.693 mln.
1 janv. 2015
Pour la date d''observation
Valeur
Changement absolu
Le changement par rapport à la valeur précédente
1 janv. 2001
144.256 mln.
+144.256 mln.
0.0%
1 janv. 2002
146.915 mln.
+2.659 mln.
1.84%
1 janv. 2003
160.09 mln.
+13.176 mln.
8.97%
1 janv. 2004
177.191 mln.
+17.1 mln.
10.68%
1 janv. 2005
196.115 mln.
+18.924 mln.
10.68%
1 janv. 2006
234.523 mln.
+38.408 mln.
19.58%
1 janv. 2007
248.614 mln.
+14.091 mln.
6.01%
1 janv. 2008
281.165 mln.
+32.551 mln.
13.09%
1 janv. 2009
282.997 mln.
+1.832 mln.
0.65%
1 janv. 2010
251.242 mln.
-31.755 mln.
-11.22%
1 janv. 2011
281.394 mln.
+30.152 mln.
12.0%
1 janv. 2012
299.044 mln.
+17.65 mln.
6.27%
1 janv. 2013
309.378 mln.
+10.334 mln.
3.46%
1 janv. 2014
316.806 mln.
+7.428 mln.
2.4%
1 janv. 2015
329.693 mln.
+12.887 mln.
4.07%
Classement des pays selon les statistiques actuelles par années

Commentaires:

Envoyer
PremiumAbout & FeedbackUn accordConfidentialité
logo
© 2022 Selected Technologies LLC – Morgan Hill, California