29
/fr/
fr
AIzaSyAYiBZKx7MnpbEhh9jyipgxe19OcubqV5w
April 1, 2024
279815
Vanuatu
VUT
true
2
1
GNI, PPP (current international $)
2015,2014,2013,2012,2011,2010,2009,2008,2007,2006,2005,2004,2003,2002,2001,2000,1999,1998,1997,1996,1995,1994,1993,1992,1991
Download
Bibliothèque de statistiques globales →Vanuatu →

GNI, PPP (current international $)

Cette statistique dans les autres pays:
AfghanistanAlbaniaAlgeriaAngolaAntigua and BarbudaArab WorldArgentinaArmeniaAustraliaAustriaAzerbaijanBahamas, TheBahrainBangladeshBarbadosBelarusBelgiumBelizeBeninBermudaBhutanBoliviaBosnia and HerzegovinaBotswanaBrazilBrunei DarussalamBulgariaBurkina FasoBurundiCabo VerdeCambodiaCameroonCanadaCaribbean small statesCentral African RepublicCentral Europe and the BalticsChadChileChinaColombiaComorosCongo, Dem. Rep.Congo, Rep.Costa RicaCote d'IvoireCroatiaCubaCyprusCzech RepublicDenmarkDjiboutiDominicaDominican RepublicEarly-demographic dividendEast Asia & PacificEast Asia & Pacific (excluding high income)East Asia & Pacific (IDA & IBRD countries)EcuadorEgypt, Arab Rep.El SalvadorEquatorial GuineaEritreaEstoniaEthiopiaEuro areaEurope & Central AsiaEurope & Central Asia (excluding high income)Europe & Central Asia (IDA & IBRD countries)European UnionFijiFinlandFragile and conflict affected situationsFranceGabonGambia, TheGeorgiaGermanyGhanaGreeceGrenadaGuatemalaGuineaGuinea-BissauGuyanaHaitiHeavily indebted poor countries (HIPC)High incomeHondurasHong Kong SAR, ChinaHungaryIBRD onlyIcelandIDA & IBRD totalIDA blendIDA onlyIDA totalIndiaIndonesiaIran, Islamic Rep.IraqIrelandIsraelItalyJamaicaJapanJordanKazakhstanKenyaKiribatiKorea, Rep.KosovoKuwaitKyrgyz RepublicLao PDRLate-demographic dividendLatin America & Caribbean Latin America & Caribbean (excluding high income)Latin America & the Caribbean (IDA & IBRD countries)LatviaLeast developed countries: UN classificationLebanonLesothoLiberiaLibyaLithuaniaLow & middle incomeLow incomeLower middle incomeLuxembourgMacao SAR, ChinaMacedonia, FYRMadagascarMalawiMalaysiaMaldivesMaliMaltaMarshall IslandsMauritaniaMauritiusMexicoMicronesia, Fed. Sts.Middle East & North AfricaMiddle East & North Africa (excluding high income)Middle East & North Africa (IDA & IBRD countries)Middle incomeMoldovaMongoliaMontenegroMoroccoMozambiqueMyanmarNamibiaNauruNepalNetherlandsNew ZealandNicaraguaNigerNigeriaNorth AmericaNorwayOECD membersOmanOther small statesPacific island small statesPakistanPalauPanamaPapua New GuineaParaguayPeruPhilippinesPolandPortugalPost-demographic dividendPre-demographic dividendPuerto RicoQatarRomaniaRussian FederationRwandaSamoaSao Tome and PrincipeSaudi ArabiaSenegalSerbiaSeychellesSierra LeoneSingaporeSlovak RepublicSloveniaSmall statesSolomon IslandsSouth AfricaSouth AsiaSouth Asia (IDA & IBRD)South SudanSpainSri LankaSt. Kitts and NevisSt. LuciaSt. Vincent and the GrenadinesSub-Saharan Africa Sub-Saharan Africa (excluding high income)Sub-Saharan Africa (IDA & IBRD countries)SudanSurinameSwazilandSwedenSwitzerlandTajikistanTanzaniaThailandTimor-LesteTogoTongaTrinidad and TobagoTunisiaTurkeyTurkmenistanTuvaluUgandaUkraineUnited Arab EmiratesUnited KingdomUnited StatesUpper middle incomeUruguayUzbekistanVanuatuVenezuela, RBVietnamWest Bank and GazaWorldYemen, Rep.ZambiaZimbabwe
La ligne de temps
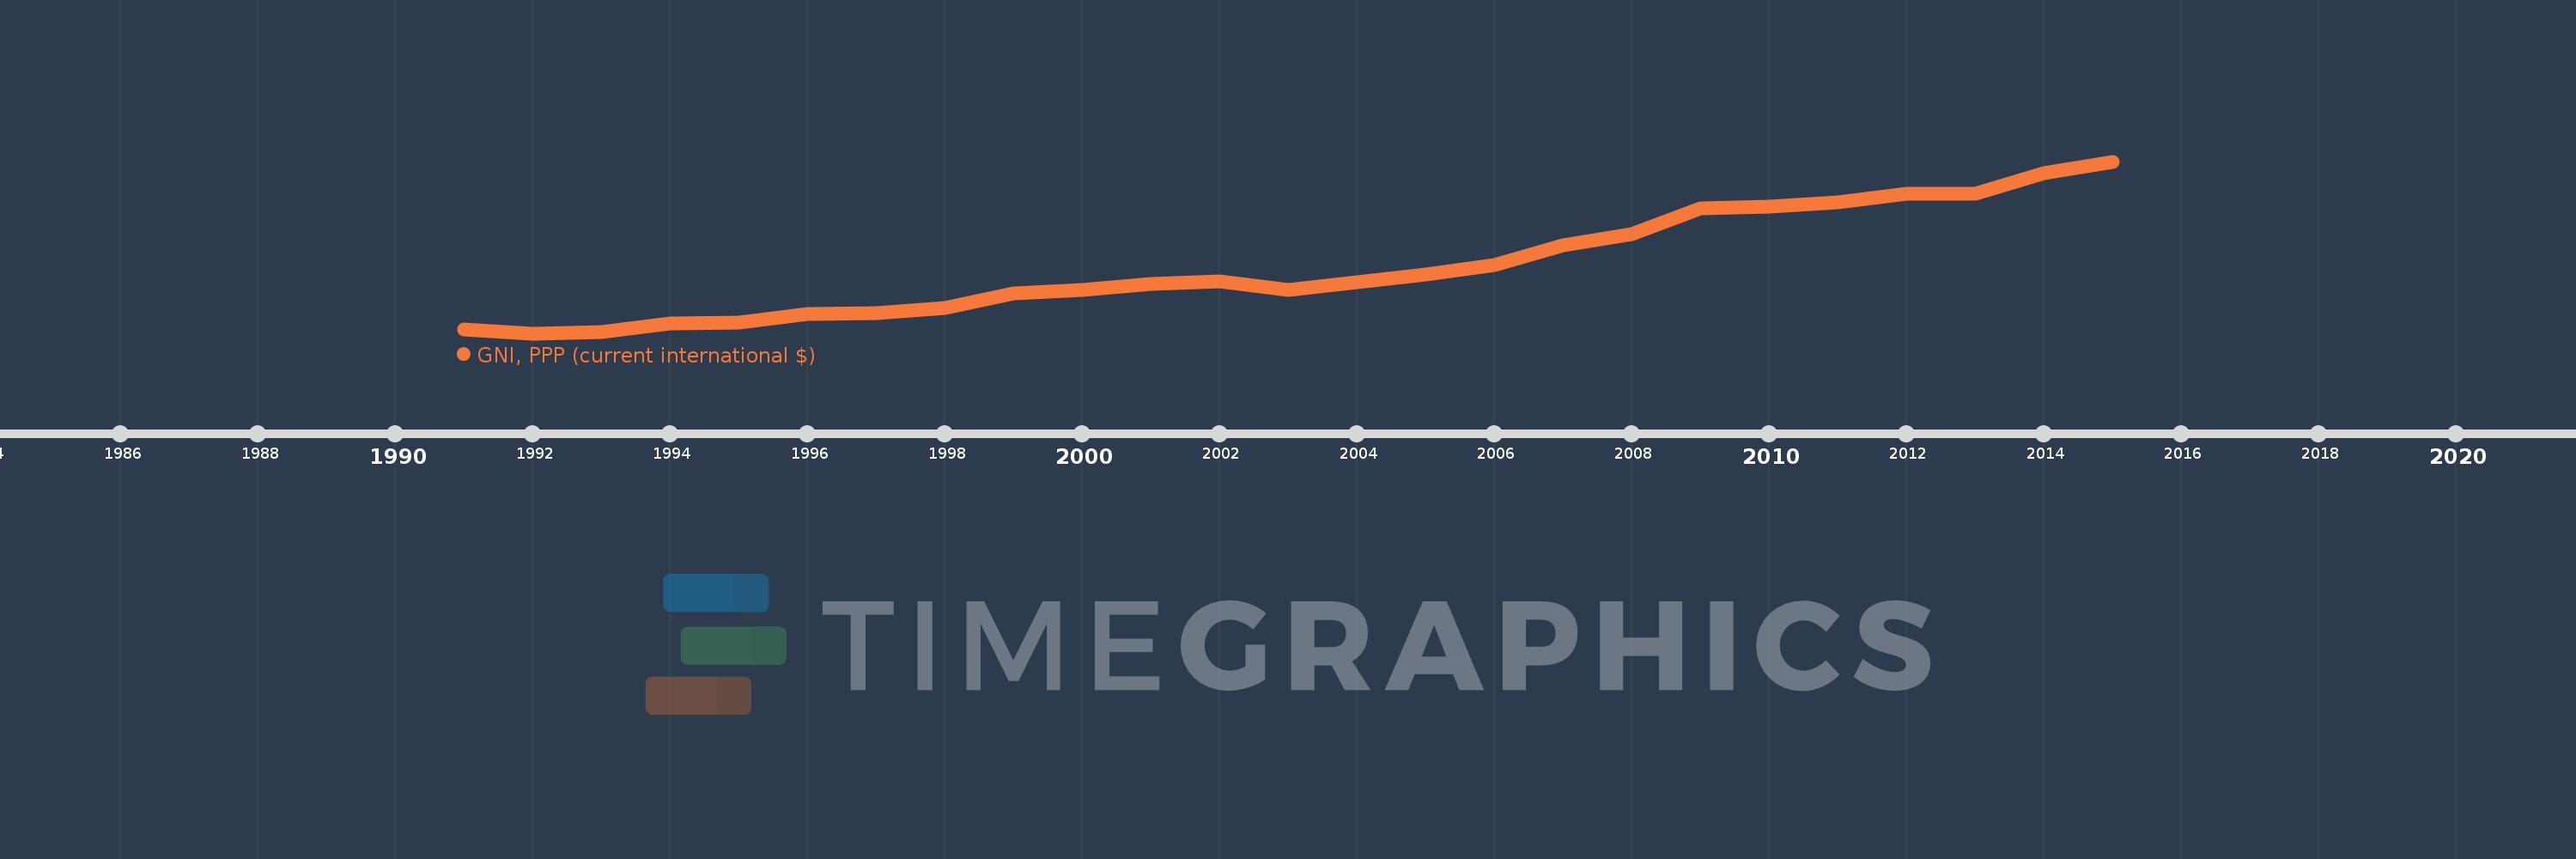
Cette échelle de temps montre un graphique de 1991 année à 2015 année Vanuatu. Les données jusqu'à 1990 année ne sont pas présentés. Quantité d'observations actuelles selon dates: 25.
Source (désignation):
Les indicateurs du développement mondiale
Source (organisation):
World Bank, International Comparison Program database.
Catégories:
Economy & Growth
Dernière mise à jour
23 avr. 2017
Les indicateurs de changement de valeurs selon les années
En moyenne:
451.676 mln.
Minimum:
235.391 mln.
1 janv. 1992
Maximum:
788.891 mln.
1 janv. 2015
Pour la date d''observation
Valeur
Changement absolu
Le changement par rapport à la valeur précédente
1 janv. 1991
248.057 mln.
+248.057 mln.
0.0%
1 janv. 1992
235.391 mln.
-12.666 mln.
-5.11%
1 janv. 1993
240.444 mln.
+5.053 mln.
2.15%
1 janv. 1994
268.218 mln.
+27.774 mln.
11.55%
1 janv. 1995
269.982 mln.
+1.764 mln.
0.66%
1 janv. 1996
296.724 mln.
+26.742 mln.
9.91%
1 janv. 1997
300.546 mln.
+3.822 mln.
1.29%
1 janv. 1998
317.11 mln.
+16.564 mln.
5.51%
1 janv. 1999
363.344 mln.
+46.233 mln.
14.58%
1 janv. 2000
374.96 mln.
+11.617 mln.
3.2%
1 janv. 2001
394.293 mln.
+19.333 mln.
5.16%
1 janv. 2002
402.406 mln.
+8.113 mln.
2.06%
1 janv. 2003
376.527 mln.
-25.879 mln.
-6.43%
1 janv. 2004
398.692 mln.
+22.165 mln.
5.89%
1 janv. 2005
424.693 mln.
+26.001 mln.
6.52%
1 janv. 2006
454.545 mln.
+29.851 mln.
7.03%
1 janv. 2007
518.817 mln.
+64.272 mln.
14.14%
1 janv. 2008
556.362 mln.
+37.545 mln.
7.24%
1 janv. 2009
637.459 mln.
+81.097 mln.
14.58%
1 janv. 2010
643.266 mln.
+5.808 mln.
0.91%
1 janv. 2011
658.086 mln.
+14.819 mln.
2.3%
1 janv. 2012
684.302 mln.
+26.217 mln.
3.98%
1 janv. 2013
686.192 mln.
+1.89 mln.
0.28%
1 janv. 2014
752.601 mln.
+66.409 mln.
9.68%
1 janv. 2015
788.891 mln.
+36.289 mln.
4.82%
Classement des pays selon les statistiques actuelles par années

Commentaires:

Envoyer
PremiumAbout & FeedbackUn accordConfidentialité
logo
© 2022 Selected Technologies LLC – Morgan Hill, California