33
/fr/
AIzaSyAYiBZKx7MnpbEhh9jyipgxe19OcubqV5w
August 1, 2025
108545
Comoros
COM
true
2
1
GNI, PPP (current international $)
2016,2015,2014,2013,2012,2011,2010,2009,2008,2007,2006,2005,2004,2003,2002,2001,2000,1999,1998,1997,1996,1995,1994,1993,1992,1991
Download
Bibliothèque de statistiques globales →Comoros →

GNI, PPP (current international $)

Cette statistique dans les autres pays:

AfghanistanAlbaniaAlgeriaAngolaAntigua and BarbudaArab WorldArgentinaArmeniaAustraliaAustriaAzerbaijanBahamas, TheBahrainBangladeshBarbadosBelarusBelgiumBelizeBeninBermudaBhutanBoliviaBosnia and HerzegovinaBotswanaBrazilBrunei DarussalamBulgariaBurkina FasoBurundiCabo VerdeCambodiaCameroonCanadaCaribbean small statesCentral African RepublicCentral Europe and the BalticsChadChileChinaColombiaComorosCongo, Dem. Rep.Congo, Rep.Costa RicaCote d'IvoireCroatiaCubaCyprusCzech RepublicDenmarkDjiboutiDominicaDominican RepublicEarly-demographic dividendEast Asia & PacificEast Asia & Pacific (excluding high income)East Asia & Pacific (IDA & IBRD countries)EcuadorEgypt, Arab Rep.El SalvadorEquatorial GuineaEritreaEstoniaEthiopiaEuro areaEurope & Central AsiaEurope & Central Asia (excluding high income)Europe & Central Asia (IDA & IBRD countries)European UnionFijiFinlandFragile and conflict affected situationsFranceGabonGambia, TheGeorgiaGermanyGhanaGreeceGrenadaGuatemalaGuineaGuinea-BissauGuyanaHaitiHeavily indebted poor countries (HIPC)High incomeHondurasHong Kong SAR, ChinaHungaryIBRD onlyIcelandIDA & IBRD totalIDA blendIDA onlyIDA totalIndiaIndonesiaIran, Islamic Rep.IraqIrelandIsraelItalyJamaicaJapanJordanKazakhstanKenyaKiribatiKorea, Rep.KosovoKuwaitKyrgyz RepublicLao PDRLate-demographic dividendLatin America & Caribbean Latin America & Caribbean (excluding high income)Latin America & the Caribbean (IDA & IBRD countries)LatviaLeast developed countries: UN classificationLebanonLesothoLiberiaLibyaLithuaniaLow & middle incomeLow incomeLower middle incomeLuxembourgMacao SAR, ChinaMacedonia, FYRMadagascarMalawiMalaysiaMaldivesMaliMaltaMarshall IslandsMauritaniaMauritiusMexicoMicronesia, Fed. Sts.Middle East & North AfricaMiddle East & North Africa (excluding high income)Middle East & North Africa (IDA & IBRD countries)Middle incomeMoldovaMongoliaMontenegroMoroccoMozambiqueMyanmarNamibiaNauruNepalNetherlandsNew ZealandNicaraguaNigerNigeriaNorth AmericaNorwayOECD membersOmanOther small statesPacific island small statesPakistanPalauPanamaPapua New GuineaParaguayPeruPhilippinesPolandPortugalPost-demographic dividendPre-demographic dividendPuerto RicoQatarRomaniaRussian FederationRwandaSamoaSao Tome and PrincipeSaudi ArabiaSenegalSerbiaSeychellesSierra LeoneSingaporeSlovak RepublicSloveniaSmall statesSolomon IslandsSouth AfricaSouth AsiaSouth Asia (IDA & IBRD)South SudanSpainSri LankaSt. Kitts and NevisSt. LuciaSt. Vincent and the GrenadinesSub-Saharan Africa Sub-Saharan Africa (excluding high income)Sub-Saharan Africa (IDA & IBRD countries)SudanSurinameSwazilandSwedenSwitzerlandTajikistanTanzaniaThailandTimor-LesteTogoTongaTrinidad and TobagoTunisiaTurkeyTurkmenistanTuvaluUgandaUkraineUnited Arab EmiratesUnited KingdomUnited StatesUpper middle incomeUruguayUzbekistanVanuatuVenezuela, RBVietnamWest Bank and GazaWorldYemen, Rep.ZambiaZimbabwe

La ligne de temps

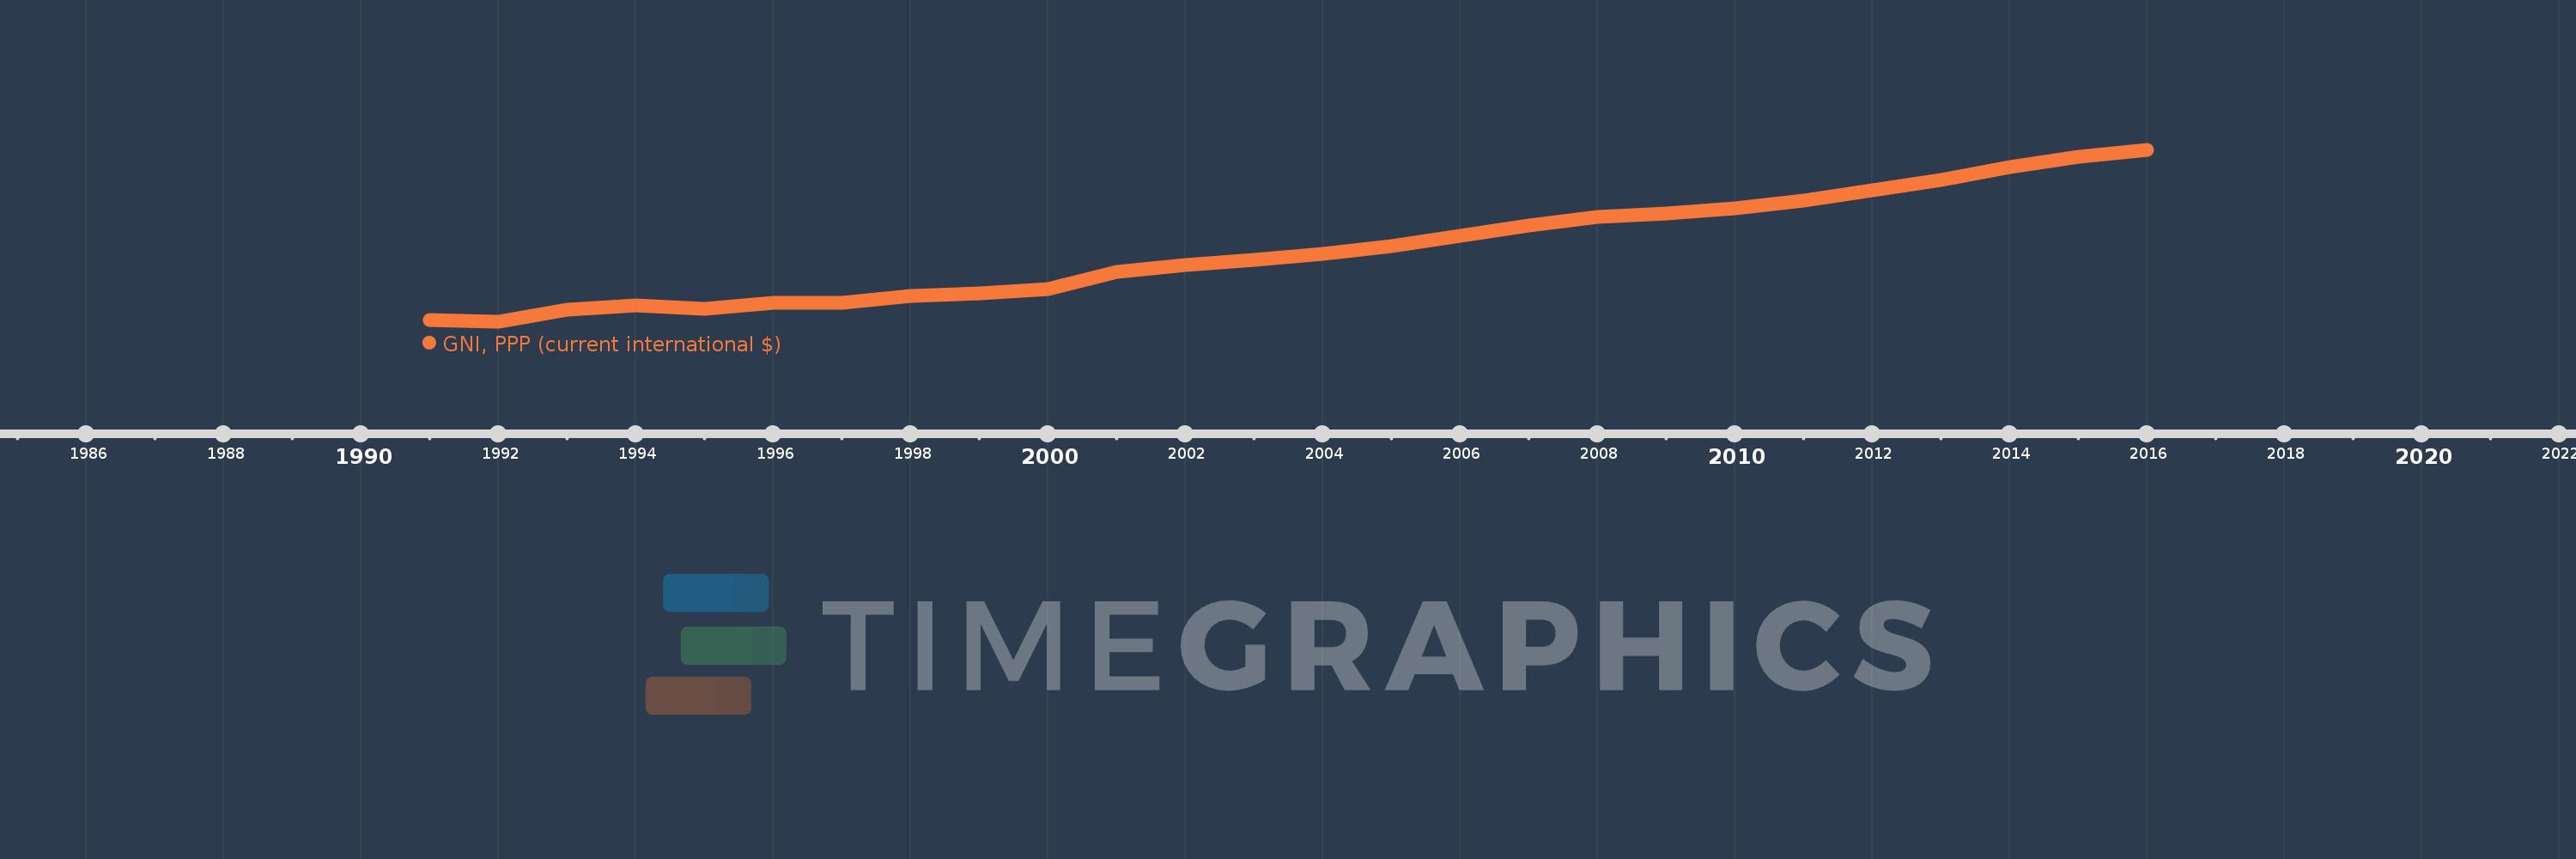
Cette échelle de temps montre un graphique de 1991 année à 2016 année Comoros. Les données jusqu'à 1990 année ne sont pas présentés. Quantité d'observations actuelles selon dates: 26.

Source (désignation):

Les indicateurs du développement mondiale

Source (organisation):

World Bank, International Comparison Program database.

Catégories:

Economy & Growth

Dernière mise à jour

23 avr. 2017

Les indicateurs de changement de valeurs selon les années

En moyenne:
736.021 mln.
Minimum:
415.207 mln.
1 janv. 1992
Maximum:
1.178 mds
1 janv. 2016
Pour la date d''observation
Valeur
Changement absolu
Le changement par rapport à la valeur précédente
1 janv. 1991
424.43 mln.
+424.43 mln.
0.0%
1 janv. 1992
415.207 mln.
-9.223 mln.
-2.17%
1 janv. 1993
468.568 mln.
+53.361 mln.
12.85%
1 janv. 1994
490.425 mln.
+21.857 mln.
4.66%
1 janv. 1995
472.321 mln.
-18.104 mln.
-3.69%
1 janv. 1996
500.555 mln.
+28.234 mln.
5.98%
1 janv. 1997
501.709 mln.
+1.155 mln.
0.23%
1 janv. 1998
530.6 mln.
+28.891 mln.
5.76%
1 janv. 1999
541.714 mln.
+11.114 mln.
2.09%
1 janv. 2000
562.055 mln.
+20.341 mln.
3.75%
1 janv. 2001
637.694 mln.
+75.639 mln.
13.46%
1 janv. 2002
668.485 mln.
+30.792 mln.
4.83%
1 janv. 2003
690.171 mln.
+21.686 mln.
3.24%
1 janv. 2004
717.882 mln.
+27.711 mln.
4.02%
1 janv. 2005
750.557 mln.
+32.675 mln.
4.55%
1 janv. 2006
797.872 mln.
+47.315 mln.
6.3%
1 janv. 2007
844.876 mln.
+47.005 mln.
5.89%
1 janv. 2008
880.349 mln.
+35.473 mln.
4.2%
1 janv. 2009
895.144 mln.
+14.795 mln.
1.68%
1 janv. 2010
920.485 mln.
+25.341 mln.
2.83%
1 janv. 2011
952.955 mln.
+32.469 mln.
3.53%
1 janv. 2012
998.184 mln.
+45.23 mln.
4.75%
1 janv. 2013
1.045 mds
+47.177 mln.
4.73%
1 janv. 2014
1.103 mds
+57.72 mln.
5.52%
1 janv. 2015
1.148 mds
+45.165 mln.
4.09%
1 janv. 2016
1.178 mds
+29.369 mln.
2.56%

Classement des pays selon les statistiques actuelles par années