33
/fr/
AIzaSyAYiBZKx7MnpbEhh9jyipgxe19OcubqV5w
August 1, 2025
177705
Lesotho
LSO
true
2
1
GNI, PPP (current international $)
2016,2015,2014,2013,2012,2011,2010,2009,2008,2007,2006,2005,2004,2003,2002,2001,2000,1999,1998,1997,1996,1995,1994,1993,1992,1991
Download
Bibliothèque de statistiques globales →Lesotho →

GNI, PPP (current international $)

Cette statistique dans les autres pays:

AfghanistanAlbaniaAlgeriaAngolaAntigua and BarbudaArab WorldArgentinaArmeniaAustraliaAustriaAzerbaijanBahamas, TheBahrainBangladeshBarbadosBelarusBelgiumBelizeBeninBermudaBhutanBoliviaBosnia and HerzegovinaBotswanaBrazilBrunei DarussalamBulgariaBurkina FasoBurundiCabo VerdeCambodiaCameroonCanadaCaribbean small statesCentral African RepublicCentral Europe and the BalticsChadChileChinaColombiaComorosCongo, Dem. Rep.Congo, Rep.Costa RicaCote d'IvoireCroatiaCubaCyprusCzech RepublicDenmarkDjiboutiDominicaDominican RepublicEarly-demographic dividendEast Asia & PacificEast Asia & Pacific (excluding high income)East Asia & Pacific (IDA & IBRD countries)EcuadorEgypt, Arab Rep.El SalvadorEquatorial GuineaEritreaEstoniaEthiopiaEuro areaEurope & Central AsiaEurope & Central Asia (excluding high income)Europe & Central Asia (IDA & IBRD countries)European UnionFijiFinlandFragile and conflict affected situationsFranceGabonGambia, TheGeorgiaGermanyGhanaGreeceGrenadaGuatemalaGuineaGuinea-BissauGuyanaHaitiHeavily indebted poor countries (HIPC)High incomeHondurasHong Kong SAR, ChinaHungaryIBRD onlyIcelandIDA & IBRD totalIDA blendIDA onlyIDA totalIndiaIndonesiaIran, Islamic Rep.IraqIrelandIsraelItalyJamaicaJapanJordanKazakhstanKenyaKiribatiKorea, Rep.KosovoKuwaitKyrgyz RepublicLao PDRLate-demographic dividendLatin America & Caribbean Latin America & Caribbean (excluding high income)Latin America & the Caribbean (IDA & IBRD countries)LatviaLeast developed countries: UN classificationLebanonLesothoLiberiaLibyaLithuaniaLow & middle incomeLow incomeLower middle incomeLuxembourgMacao SAR, ChinaMacedonia, FYRMadagascarMalawiMalaysiaMaldivesMaliMaltaMarshall IslandsMauritaniaMauritiusMexicoMicronesia, Fed. Sts.Middle East & North AfricaMiddle East & North Africa (excluding high income)Middle East & North Africa (IDA & IBRD countries)Middle incomeMoldovaMongoliaMontenegroMoroccoMozambiqueMyanmarNamibiaNauruNepalNetherlandsNew ZealandNicaraguaNigerNigeriaNorth AmericaNorwayOECD membersOmanOther small statesPacific island small statesPakistanPalauPanamaPapua New GuineaParaguayPeruPhilippinesPolandPortugalPost-demographic dividendPre-demographic dividendPuerto RicoQatarRomaniaRussian FederationRwandaSamoaSao Tome and PrincipeSaudi ArabiaSenegalSerbiaSeychellesSierra LeoneSingaporeSlovak RepublicSloveniaSmall statesSolomon IslandsSouth AfricaSouth AsiaSouth Asia (IDA & IBRD)South SudanSpainSri LankaSt. Kitts and NevisSt. LuciaSt. Vincent and the GrenadinesSub-Saharan Africa Sub-Saharan Africa (excluding high income)Sub-Saharan Africa (IDA & IBRD countries)SudanSurinameSwazilandSwedenSwitzerlandTajikistanTanzaniaThailandTimor-LesteTogoTongaTrinidad and TobagoTunisiaTurkeyTurkmenistanTuvaluUgandaUkraineUnited Arab EmiratesUnited KingdomUnited StatesUpper middle incomeUruguayUzbekistanVanuatuVenezuela, RBVietnamWest Bank and GazaWorldYemen, Rep.ZambiaZimbabwe

La ligne de temps

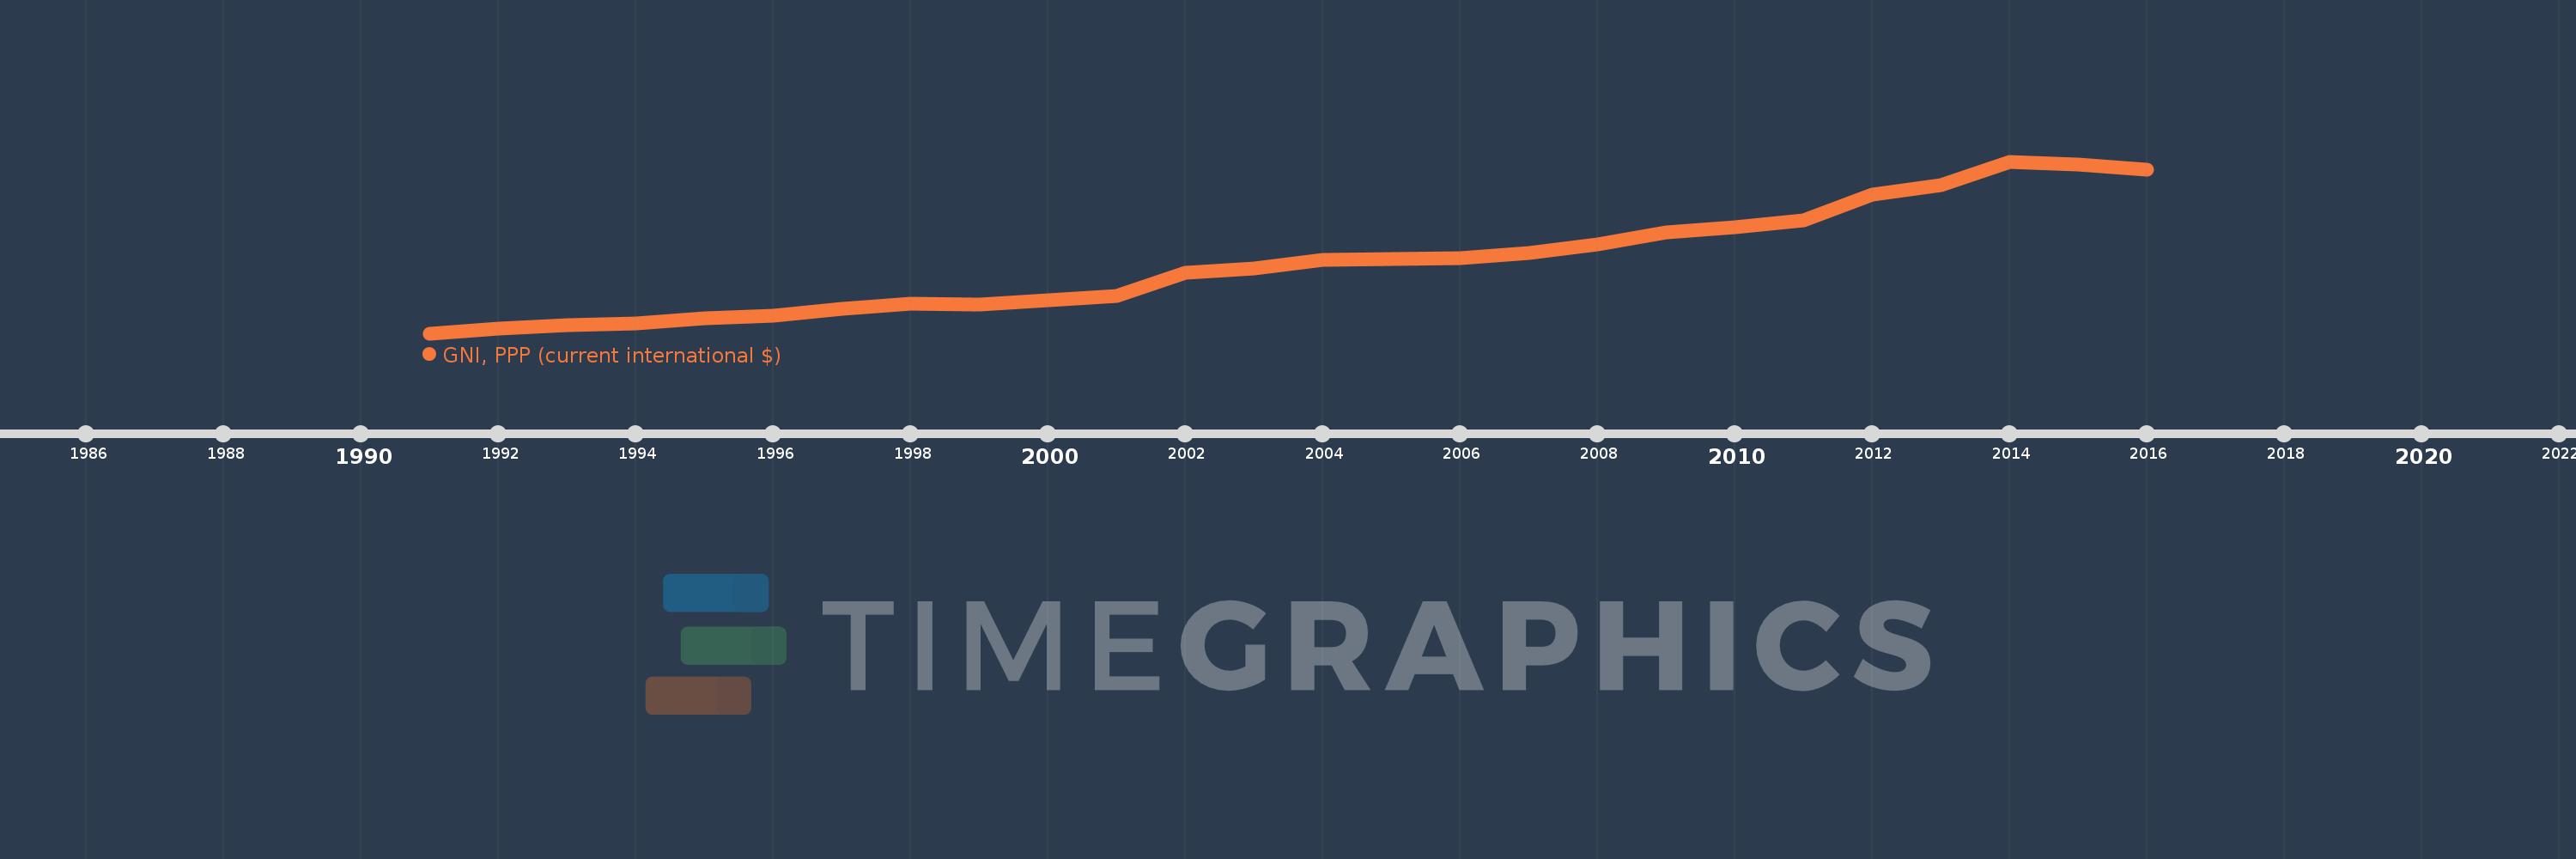
Cette échelle de temps montre un graphique de 1991 année à 2016 année Lesotho. Les données jusqu'à 1990 année ne sont pas présentés. Quantité d'observations actuelles selon dates: 26.

Source (désignation):

Les indicateurs du développement mondiale

Source (organisation):

World Bank, International Comparison Program database.

Catégories:

Economy & Growth

Dernière mise à jour

23 avr. 2017

Les indicateurs de changement de valeurs selon les années

En moyenne:
4.313 mds
Minimum:
2.262 mds
1 janv. 1991
Maximum:
7.248 mds
1 janv. 2014
Pour la date d''observation
Valeur
Changement absolu
Le changement par rapport à la valeur précédente
1 janv. 1991
2.262 mds
+2.262 mds
0.0%
1 janv. 1992
2.406 mds
+143.05 mln.
6.32%
1 janv. 1993
2.505 mds
+99.059 mln.
4.12%
1 janv. 1994
2.54 mds
+35.78 mln.
1.43%
1 janv. 1995
2.699 mds
+158.517 mln.
6.24%
1 janv. 1996
2.778 mds
+79.053 mln.
2.93%
1 janv. 1997
2.977 mds
+199.533 mln.
7.18%
1 janv. 1998
3.111 mds
+133.549 mln.
4.49%
1 janv. 1999
3.097 mds
-13.85 mln.
-0.45%
1 janv. 2000
3.226 mds
+128.568 mln.
4.15%
1 janv. 2001
3.338 mds
+112.031 mln.
3.47%
1 janv. 2002
4.027 mds
+689.67 mln.
20.66%
1 janv. 2003
4.155 mds
+127.605 mln.
3.17%
1 janv. 2004
4.397 mds
+242.184 mln.
5.83%
1 janv. 2005
4.412 mds
+15.131 mln.
0.34%
1 janv. 2006
4.437 mds
+24.919 mln.
0.56%
1 janv. 2007
4.583 mds
+146.03 mln.
3.29%
1 janv. 2008
4.853 mds
+269.863 mln.
5.89%
1 janv. 2009
5.191 mds
+338.277 mln.
6.97%
1 janv. 2010
5.34 mds
+148.875 mln.
2.87%
1 janv. 2011
5.544 mds
+203.374 mln.
3.81%
1 janv. 2012
6.287 mds
+743.072 mln.
13.4%
1 janv. 2013
6.553 mds
+266.652 mln.
4.24%
1 janv. 2014
7.248 mds
+695.006 mln.
10.61%
1 janv. 2015
7.155 mds
-93.703 mln.
-1.29%
1 janv. 2016
7.014 mds
-140.375 mln.
-1.96%

Classement des pays selon les statistiques actuelles par années