33
/fr/
AIzaSyAYiBZKx7MnpbEhh9jyipgxe19OcubqV5w
August 1, 2025
191433
Malta
MLT
true
2
1
GNI, PPP (current international $)
2016,2015,2014,2013,2012,2011,2010,2009,2008,2007,2006,2005,2004,2003,2002,2001,2000,1999,1998,1997,1996,1995,1994,1993,1992,1991
Download
Bibliothèque de statistiques globales →Malta →

GNI, PPP (current international $)

Cette statistique dans les autres pays:

AfghanistanAlbaniaAlgeriaAngolaAntigua and BarbudaArab WorldArgentinaArmeniaAustraliaAustriaAzerbaijanBahamas, TheBahrainBangladeshBarbadosBelarusBelgiumBelizeBeninBermudaBhutanBoliviaBosnia and HerzegovinaBotswanaBrazilBrunei DarussalamBulgariaBurkina FasoBurundiCabo VerdeCambodiaCameroonCanadaCaribbean small statesCentral African RepublicCentral Europe and the BalticsChadChileChinaColombiaComorosCongo, Dem. Rep.Congo, Rep.Costa RicaCote d'IvoireCroatiaCubaCyprusCzech RepublicDenmarkDjiboutiDominicaDominican RepublicEarly-demographic dividendEast Asia & PacificEast Asia & Pacific (excluding high income)East Asia & Pacific (IDA & IBRD countries)EcuadorEgypt, Arab Rep.El SalvadorEquatorial GuineaEritreaEstoniaEthiopiaEuro areaEurope & Central AsiaEurope & Central Asia (excluding high income)Europe & Central Asia (IDA & IBRD countries)European UnionFijiFinlandFragile and conflict affected situationsFranceGabonGambia, TheGeorgiaGermanyGhanaGreeceGrenadaGuatemalaGuineaGuinea-BissauGuyanaHaitiHeavily indebted poor countries (HIPC)High incomeHondurasHong Kong SAR, ChinaHungaryIBRD onlyIcelandIDA & IBRD totalIDA blendIDA onlyIDA totalIndiaIndonesiaIran, Islamic Rep.IraqIrelandIsraelItalyJamaicaJapanJordanKazakhstanKenyaKiribatiKorea, Rep.KosovoKuwaitKyrgyz RepublicLao PDRLate-demographic dividendLatin America & Caribbean Latin America & Caribbean (excluding high income)Latin America & the Caribbean (IDA & IBRD countries)LatviaLeast developed countries: UN classificationLebanonLesothoLiberiaLibyaLithuaniaLow & middle incomeLow incomeLower middle incomeLuxembourgMacao SAR, ChinaMacedonia, FYRMadagascarMalawiMalaysiaMaldivesMaliMaltaMarshall IslandsMauritaniaMauritiusMexicoMicronesia, Fed. Sts.Middle East & North AfricaMiddle East & North Africa (excluding high income)Middle East & North Africa (IDA & IBRD countries)Middle incomeMoldovaMongoliaMontenegroMoroccoMozambiqueMyanmarNamibiaNauruNepalNetherlandsNew ZealandNicaraguaNigerNigeriaNorth AmericaNorwayOECD membersOmanOther small statesPacific island small statesPakistanPalauPanamaPapua New GuineaParaguayPeruPhilippinesPolandPortugalPost-demographic dividendPre-demographic dividendPuerto RicoQatarRomaniaRussian FederationRwandaSamoaSao Tome and PrincipeSaudi ArabiaSenegalSerbiaSeychellesSierra LeoneSingaporeSlovak RepublicSloveniaSmall statesSolomon IslandsSouth AfricaSouth AsiaSouth Asia (IDA & IBRD)South SudanSpainSri LankaSt. Kitts and NevisSt. LuciaSt. Vincent and the GrenadinesSub-Saharan Africa Sub-Saharan Africa (excluding high income)Sub-Saharan Africa (IDA & IBRD countries)SudanSurinameSwazilandSwedenSwitzerlandTajikistanTanzaniaThailandTimor-LesteTogoTongaTrinidad and TobagoTunisiaTurkeyTurkmenistanTuvaluUgandaUkraineUnited Arab EmiratesUnited KingdomUnited StatesUpper middle incomeUruguayUzbekistanVanuatuVenezuela, RBVietnamWest Bank and GazaWorldYemen, Rep.ZambiaZimbabwe

La ligne de temps

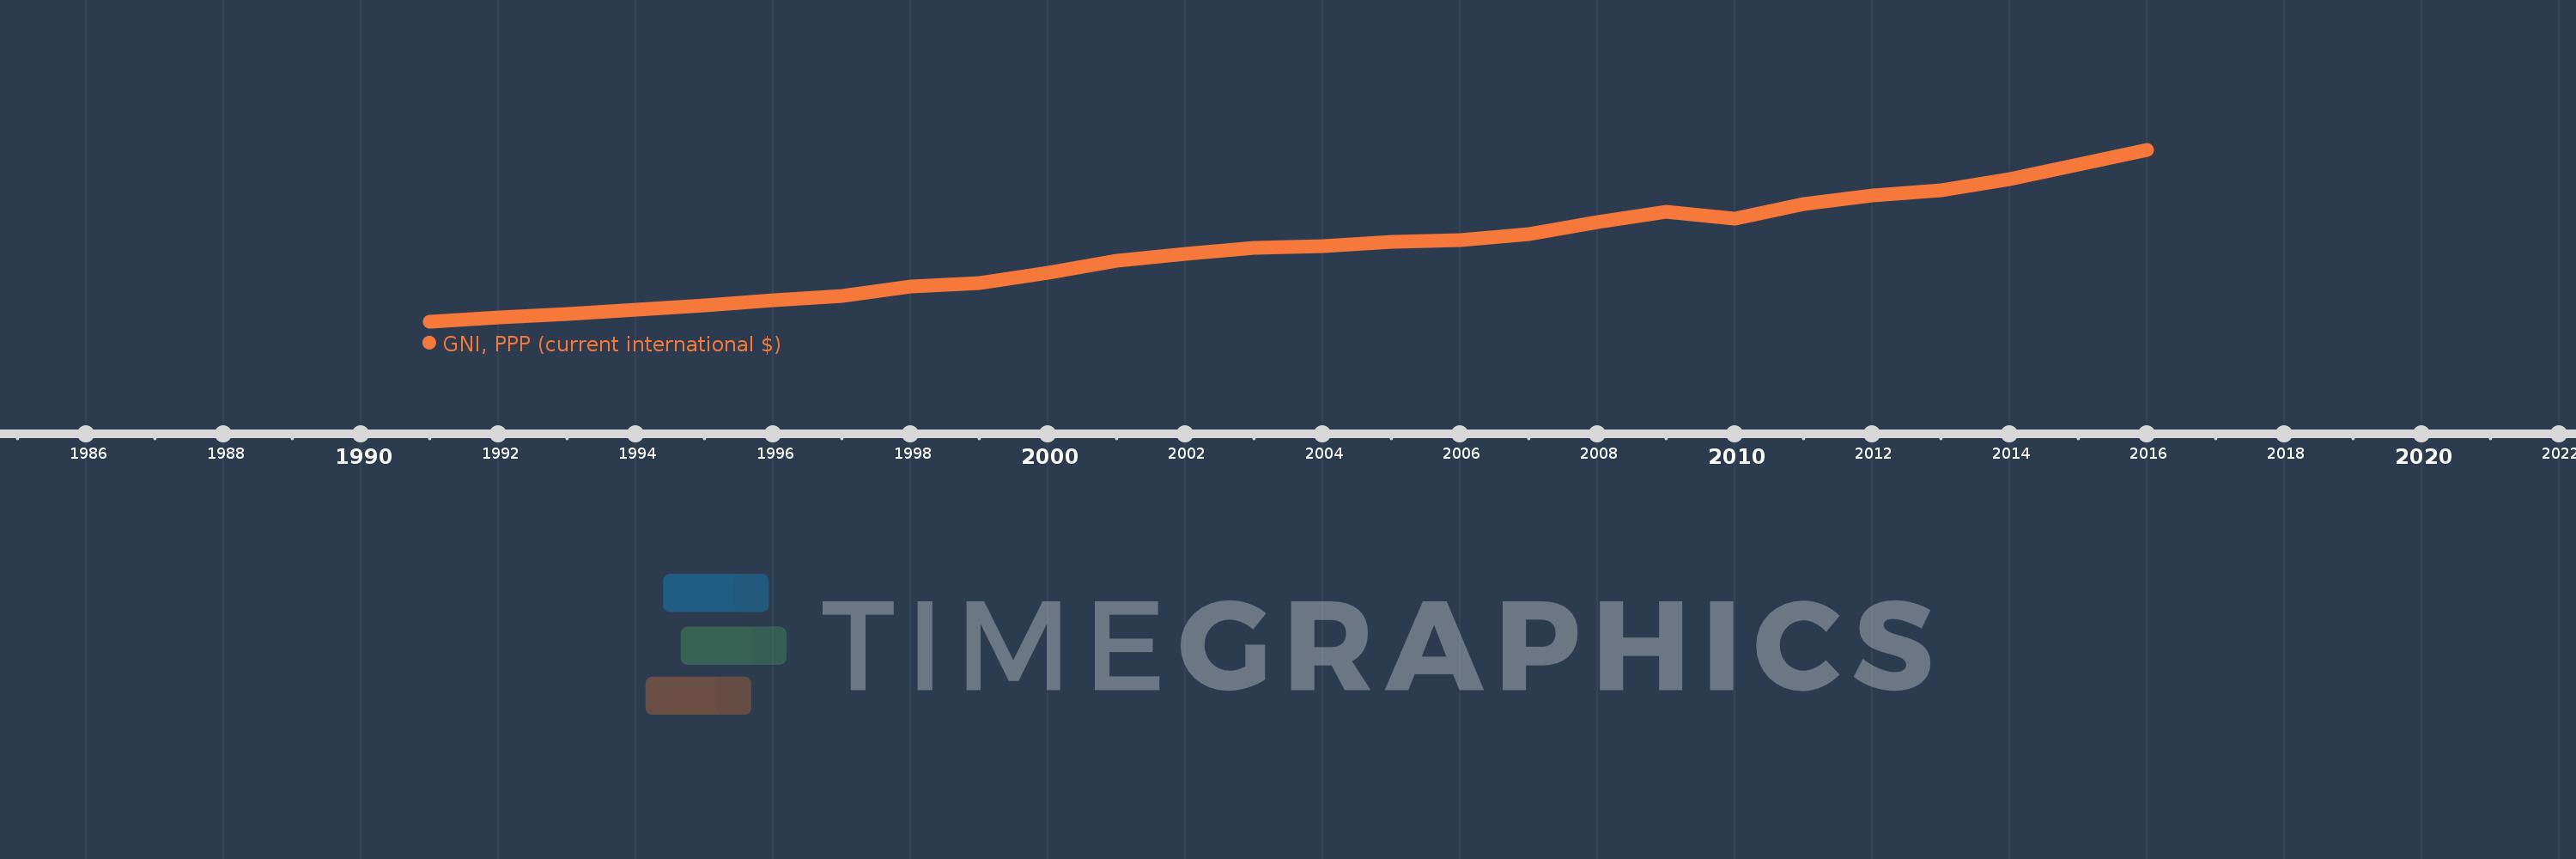
Cette échelle de temps montre un graphique de 1991 année à 2016 année Malta. Les données jusqu'à 1990 année ne sont pas présentés. Quantité d'observations actuelles selon dates: 26.

Source (désignation):

Les indicateurs du développement mondiale

Source (organisation):

World Bank, International Comparison Program database.

Catégories:

Economy & Growth

Dernière mise à jour

23 avr. 2017

Les indicateurs de changement de valeurs selon les années

En moyenne:
8.145 mds
Minimum:
3.555 mds
1 janv. 1991
Maximum:
14.323 mds
1 janv. 2016
Pour la date d''observation
Valeur
Changement absolu
Le changement par rapport à la valeur précédente
1 janv. 1991
3.555 mds
+3.555 mds
0.0%
1 janv. 1992
3.855 mds
+299.785 mln.
8.43%
1 janv. 1993
4.074 mds
+218.856 mln.
5.68%
1 janv. 1994
4.317 mds
+242.559 mln.
5.95%
1 janv. 1995
4.573 mds
+255.982 mln.
5.93%
1 janv. 1996
4.926 mds
+353.819 mln.
7.74%
1 janv. 1997
5.21 mds
+283.848 mln.
5.76%
1 janv. 1998
5.801 mds
+591.179 mln.
11.35%
1 janv. 1999
6.004 mds
+202.049 mln.
3.48%
1 janv. 2000
6.638 mds
+634.589 mln.
10.57%
1 janv. 2001
7.411 mds
+772.929 mln.
11.64%
1 janv. 2002
7.8 mds
+388.555 mln.
5.24%
1 janv. 2003
8.183 mds
+383.356 mln.
4.92%
1 janv. 2004
8.3 mds
+117.346 mln.
1.43%
1 janv. 2005
8.574 mds
+273.504 mln.
3.3%
1 janv. 2006
8.692 mds
+118.139 mln.
1.38%
1 janv. 2007
9.078 mds
+385.794 mln.
4.44%
1 janv. 2008
9.803 mds
+724.941 mln.
7.99%
1 janv. 2009
10.453 mds
+650.156 mln.
6.63%
1 janv. 2010
10.057 mds
-395.91 mln.
-3.79%
1 janv. 2011
10.944 mds
+886.873 mln.
8.82%
1 janv. 2012
11.464 mds
+520.074 mln.
4.75%
1 janv. 2013
11.812 mds
+348.508 mln.
3.04%
1 janv. 2014
12.499 mds
+687.007 mln.
5.82%
1 janv. 2015
13.419 mds
+919.737 mln.
7.36%
1 janv. 2016
14.323 mds
+904.134 mln.
6.74%

Classement des pays selon les statistiques actuelles par années