33
/fr/
AIzaSyAYiBZKx7MnpbEhh9jyipgxe19OcubqV5w
August 1, 2025
238288
Seychelles
SYC
true
2
1
GNI, PPP (current international $)
2016,2015,2014,2013,2012,2011,2010,2009,2008,2007,2006,2005,2004,2003,2002,2001,2000,1999,1998,1997,1996,1995,1994,1993,1992,1991
Download
Bibliothèque de statistiques globales →Seychelles →

GNI, PPP (current international $)

Cette statistique dans les autres pays:

AfghanistanAlbaniaAlgeriaAngolaAntigua and BarbudaArab WorldArgentinaArmeniaAustraliaAustriaAzerbaijanBahamas, TheBahrainBangladeshBarbadosBelarusBelgiumBelizeBeninBermudaBhutanBoliviaBosnia and HerzegovinaBotswanaBrazilBrunei DarussalamBulgariaBurkina FasoBurundiCabo VerdeCambodiaCameroonCanadaCaribbean small statesCentral African RepublicCentral Europe and the BalticsChadChileChinaColombiaComorosCongo, Dem. Rep.Congo, Rep.Costa RicaCote d'IvoireCroatiaCubaCyprusCzech RepublicDenmarkDjiboutiDominicaDominican RepublicEarly-demographic dividendEast Asia & PacificEast Asia & Pacific (excluding high income)East Asia & Pacific (IDA & IBRD countries)EcuadorEgypt, Arab Rep.El SalvadorEquatorial GuineaEritreaEstoniaEthiopiaEuro areaEurope & Central AsiaEurope & Central Asia (excluding high income)Europe & Central Asia (IDA & IBRD countries)European UnionFijiFinlandFragile and conflict affected situationsFranceGabonGambia, TheGeorgiaGermanyGhanaGreeceGrenadaGuatemalaGuineaGuinea-BissauGuyanaHaitiHeavily indebted poor countries (HIPC)High incomeHondurasHong Kong SAR, ChinaHungaryIBRD onlyIcelandIDA & IBRD totalIDA blendIDA onlyIDA totalIndiaIndonesiaIran, Islamic Rep.IraqIrelandIsraelItalyJamaicaJapanJordanKazakhstanKenyaKiribatiKorea, Rep.KosovoKuwaitKyrgyz RepublicLao PDRLate-demographic dividendLatin America & Caribbean Latin America & Caribbean (excluding high income)Latin America & the Caribbean (IDA & IBRD countries)LatviaLeast developed countries: UN classificationLebanonLesothoLiberiaLibyaLithuaniaLow & middle incomeLow incomeLower middle incomeLuxembourgMacao SAR, ChinaMacedonia, FYRMadagascarMalawiMalaysiaMaldivesMaliMaltaMarshall IslandsMauritaniaMauritiusMexicoMicronesia, Fed. Sts.Middle East & North AfricaMiddle East & North Africa (excluding high income)Middle East & North Africa (IDA & IBRD countries)Middle incomeMoldovaMongoliaMontenegroMoroccoMozambiqueMyanmarNamibiaNauruNepalNetherlandsNew ZealandNicaraguaNigerNigeriaNorth AmericaNorwayOECD membersOmanOther small statesPacific island small statesPakistanPalauPanamaPapua New GuineaParaguayPeruPhilippinesPolandPortugalPost-demographic dividendPre-demographic dividendPuerto RicoQatarRomaniaRussian FederationRwandaSamoaSao Tome and PrincipeSaudi ArabiaSenegalSerbiaSeychellesSierra LeoneSingaporeSlovak RepublicSloveniaSmall statesSolomon IslandsSouth AfricaSouth AsiaSouth Asia (IDA & IBRD)South SudanSpainSri LankaSt. Kitts and NevisSt. LuciaSt. Vincent and the GrenadinesSub-Saharan Africa Sub-Saharan Africa (excluding high income)Sub-Saharan Africa (IDA & IBRD countries)SudanSurinameSwazilandSwedenSwitzerlandTajikistanTanzaniaThailandTimor-LesteTogoTongaTrinidad and TobagoTunisiaTurkeyTurkmenistanTuvaluUgandaUkraineUnited Arab EmiratesUnited KingdomUnited StatesUpper middle incomeUruguayUzbekistanVanuatuVenezuela, RBVietnamWest Bank and GazaWorldYemen, Rep.ZambiaZimbabwe

La ligne de temps

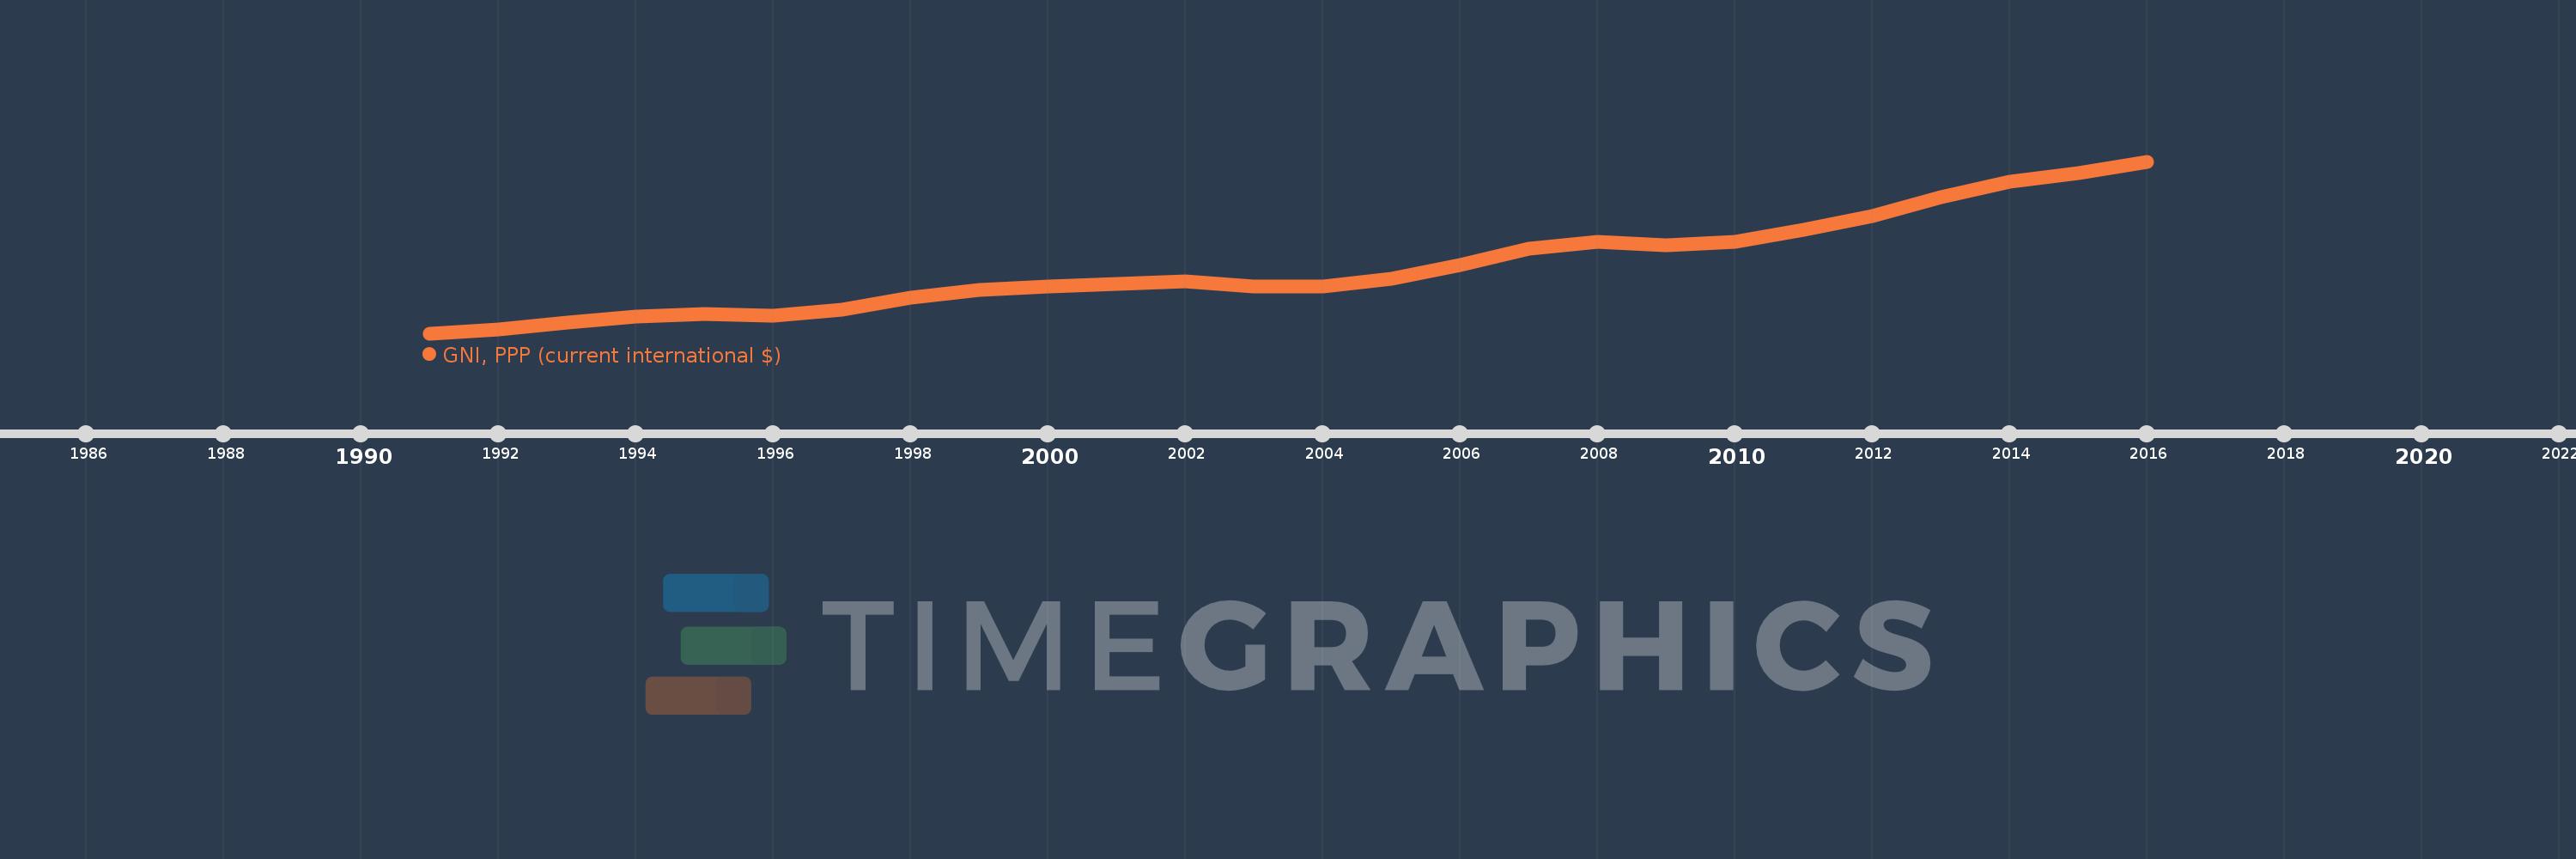
Cette échelle de temps montre un graphique de 1991 année à 2016 année Seychelles. Les données jusqu'à 1990 année ne sont pas présentés. Quantité d'observations actuelles selon dates: 26.

Source (désignation):

Les indicateurs du développement mondiale

Source (organisation):

World Bank, International Comparison Program database.

Catégories:

Economy & Growth

Dernière mise à jour

23 avr. 2017

Les indicateurs de changement de valeurs selon les années

En moyenne:
1.307 mds
Minimum:
615.881 mln.
1 janv. 1991
Maximum:
2.398 mds
1 janv. 2016
Pour la date d''observation
Valeur
Changement absolu
Le changement par rapport à la valeur précédente
1 janv. 1991
615.881 mln.
+615.881 mln.
0.0%
1 janv. 1992
658.592 mln.
+42.712 mln.
6.94%
1 janv. 1993
727.351 mln.
+68.758 mln.
10.44%
1 janv. 1994
789.623 mln.
+62.272 mln.
8.56%
1 janv. 1995
812.233 mln.
+22.61 mln.
2.86%
1 janv. 1996
796.875 mln.
-15.358 mln.
-1.89%
1 janv. 1997
859.079 mln.
+62.204 mln.
7.81%
1 janv. 1998
986.476 mln.
+127.397 mln.
14.83%
1 janv. 1999
1.067 mds
+80.486 mln.
8.16%
1 janv. 2000
1.097 mds
+30.383 mln.
2.85%
1 janv. 2001
1.126 mds
+28.264 mln.
2.58%
1 janv. 2002
1.153 mds
+27.293 mln.
2.42%
1 janv. 2003
1.1 mds
-52.799 mln.
-4.58%
1 janv. 2004
1.099 mds
-1.32 mln.
-0.12%
1 janv. 2005
1.181 mds
+82.321 mln.
7.49%
1 janv. 2006
1.328 mds
+147.042 mln.
12.45%
1 janv. 2007
1.497 mds
+168.846 mln.
12.71%
1 janv. 2008
1.563 mds
+66.047 mln.
4.41%
1 janv. 2009
1.533 mds
-29.887 mln.
-1.91%
1 janv. 2010
1.561 mds
+27.441 mln.
1.79%
1 janv. 2011
1.691 mds
+130.461 mln.
8.36%
1 janv. 2012
1.835 mds
+144.428 mln.
8.54%
1 janv. 2013
2.025 mds
+189.329 mln.
10.31%
1 janv. 2014
2.19 mds
+165.001 mln.
8.15%
1 janv. 2015
2.279 mds
+89.306 mln.
4.08%
1 janv. 2016
2.398 mds
+118.852 mln.
5.21%

Classement des pays selon les statistiques actuelles par années