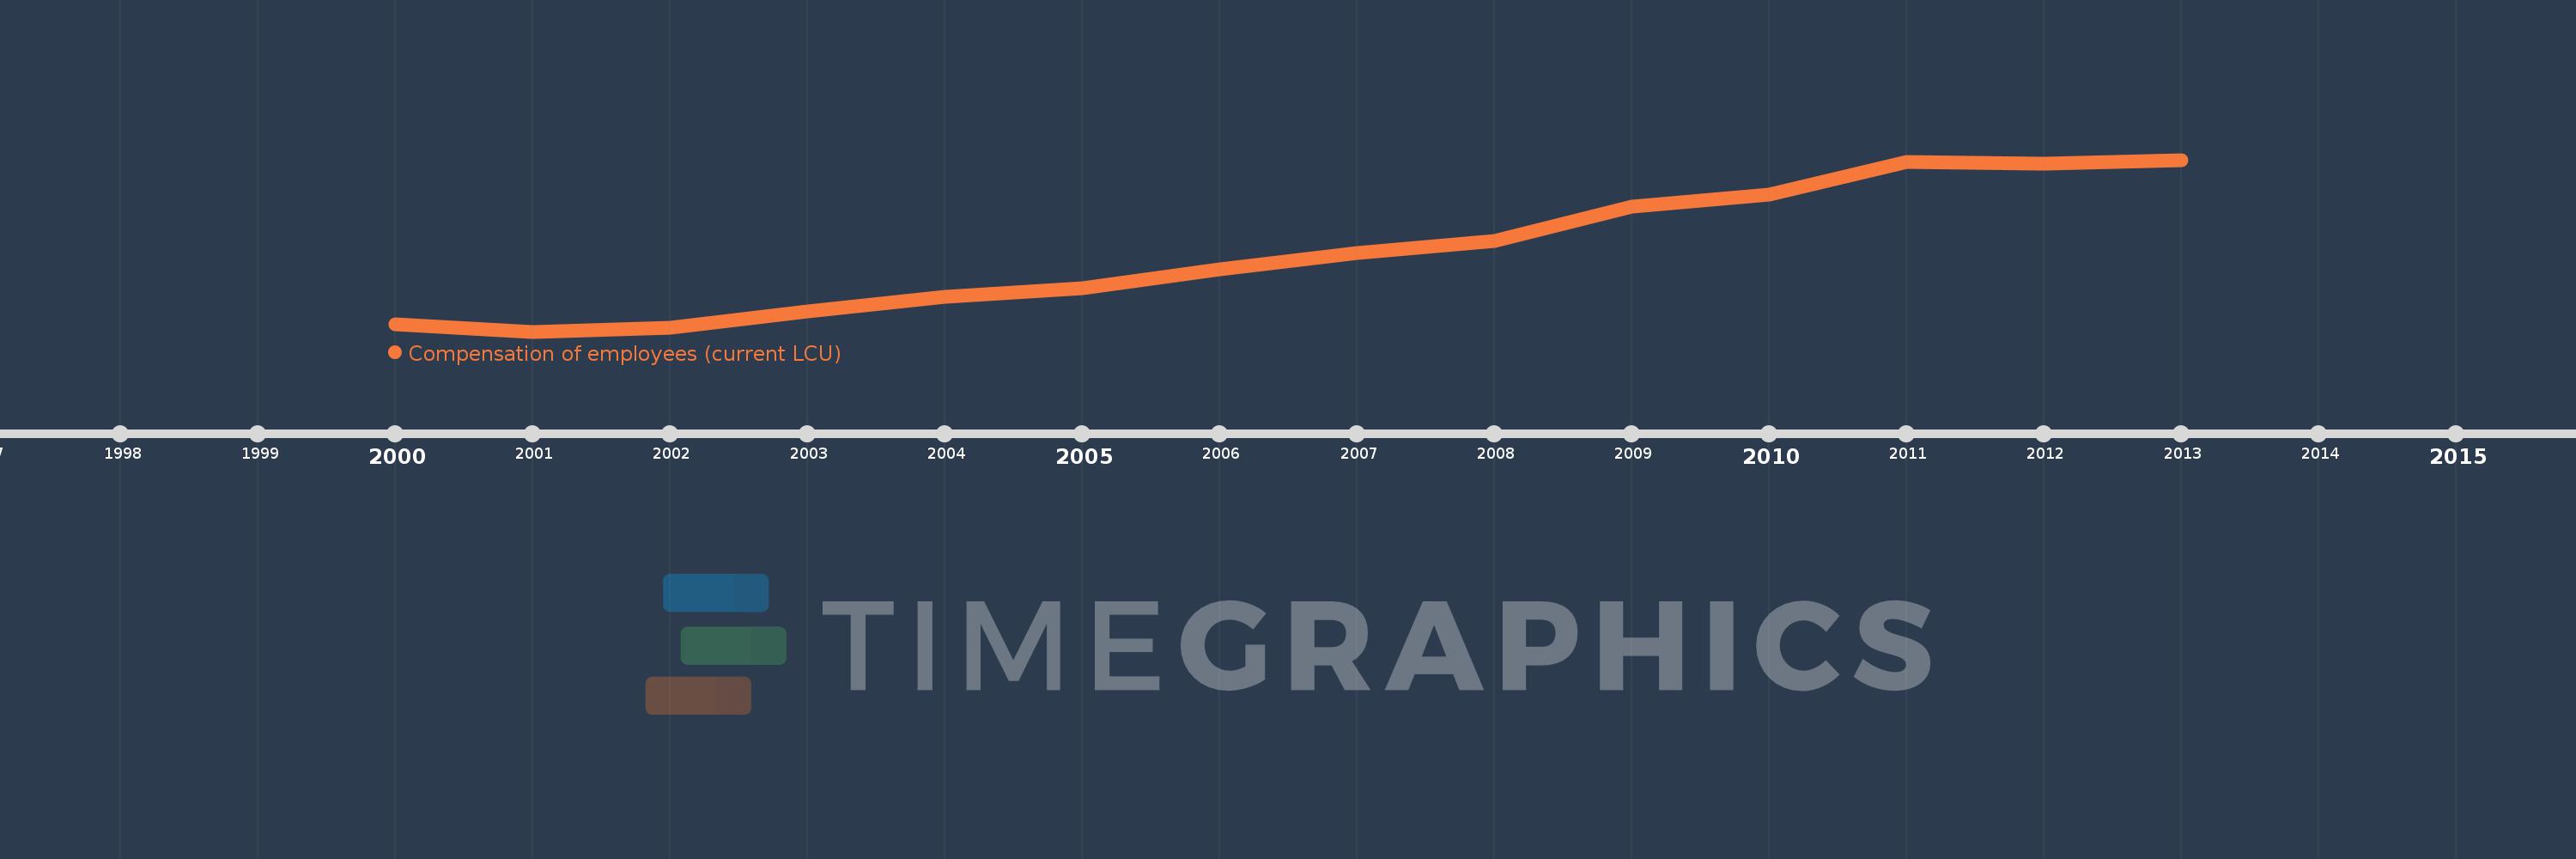
Cette échelle de temps montre un graphique de 2000 année à 2013 année Swaziland. Les données jusqu'à 1999 année ne sont pas présentés. Quantité d'observations actuelles selon dates: 14.
Source (désignation):
Les indicateurs du développement mondiale
Source (organisation):
International Monetary Fund, Government Finance Statistics Yearbook and data files.
Catégories:
Public Sector
Dernière mise à jour
23 avr. 2017
Les indicateurs de changement de valeurs selon les années
En moyenne:
2.582 mds
Minimum:
941.533 mln.
1 janv. 2001
Maximum:
4.486 mds
1 janv. 2013
Pour la date d''observation
Valeur
Changement absolu
Le changement par rapport à la valeur précédente
1 janv. 2000
1.087 mds
+1.087 mds
0.0%
1 janv. 2001
941.533 mln.
-145.367 mln.
-13.37%
1 janv. 2002
1.024 mds
+82.841 mln.
8.8%
1 janv. 2003
1.366 mds
+341.876 mln.
33.37%
1 janv. 2004
1.662 mds
+295.94 mln.
21.66%
1 janv. 2005
1.839 mds
+176.691 mln.
10.63%
1 janv. 2006
2.218 mds
+379.17 mln.
20.62%
1 janv. 2007
2.571 mds
+352.679 mln.
15.9%
1 janv. 2008
2.814 mds
+243.349 mln.
9.47%
1 janv. 2009
3.519 mds
+705.387 mln.
25.07%
1 janv. 2010
3.773 mds
+253.128 mln.
7.19%
1 janv. 2011
4.445 mds
+671.993 mln.
17.81%
1 janv. 2012
4.406 mds
-38.425 mln.
-0.86%
1 janv. 2013
4.486 mds
+79.554 mln.
1.81%
Classement des pays selon les statistiques actuelles par années