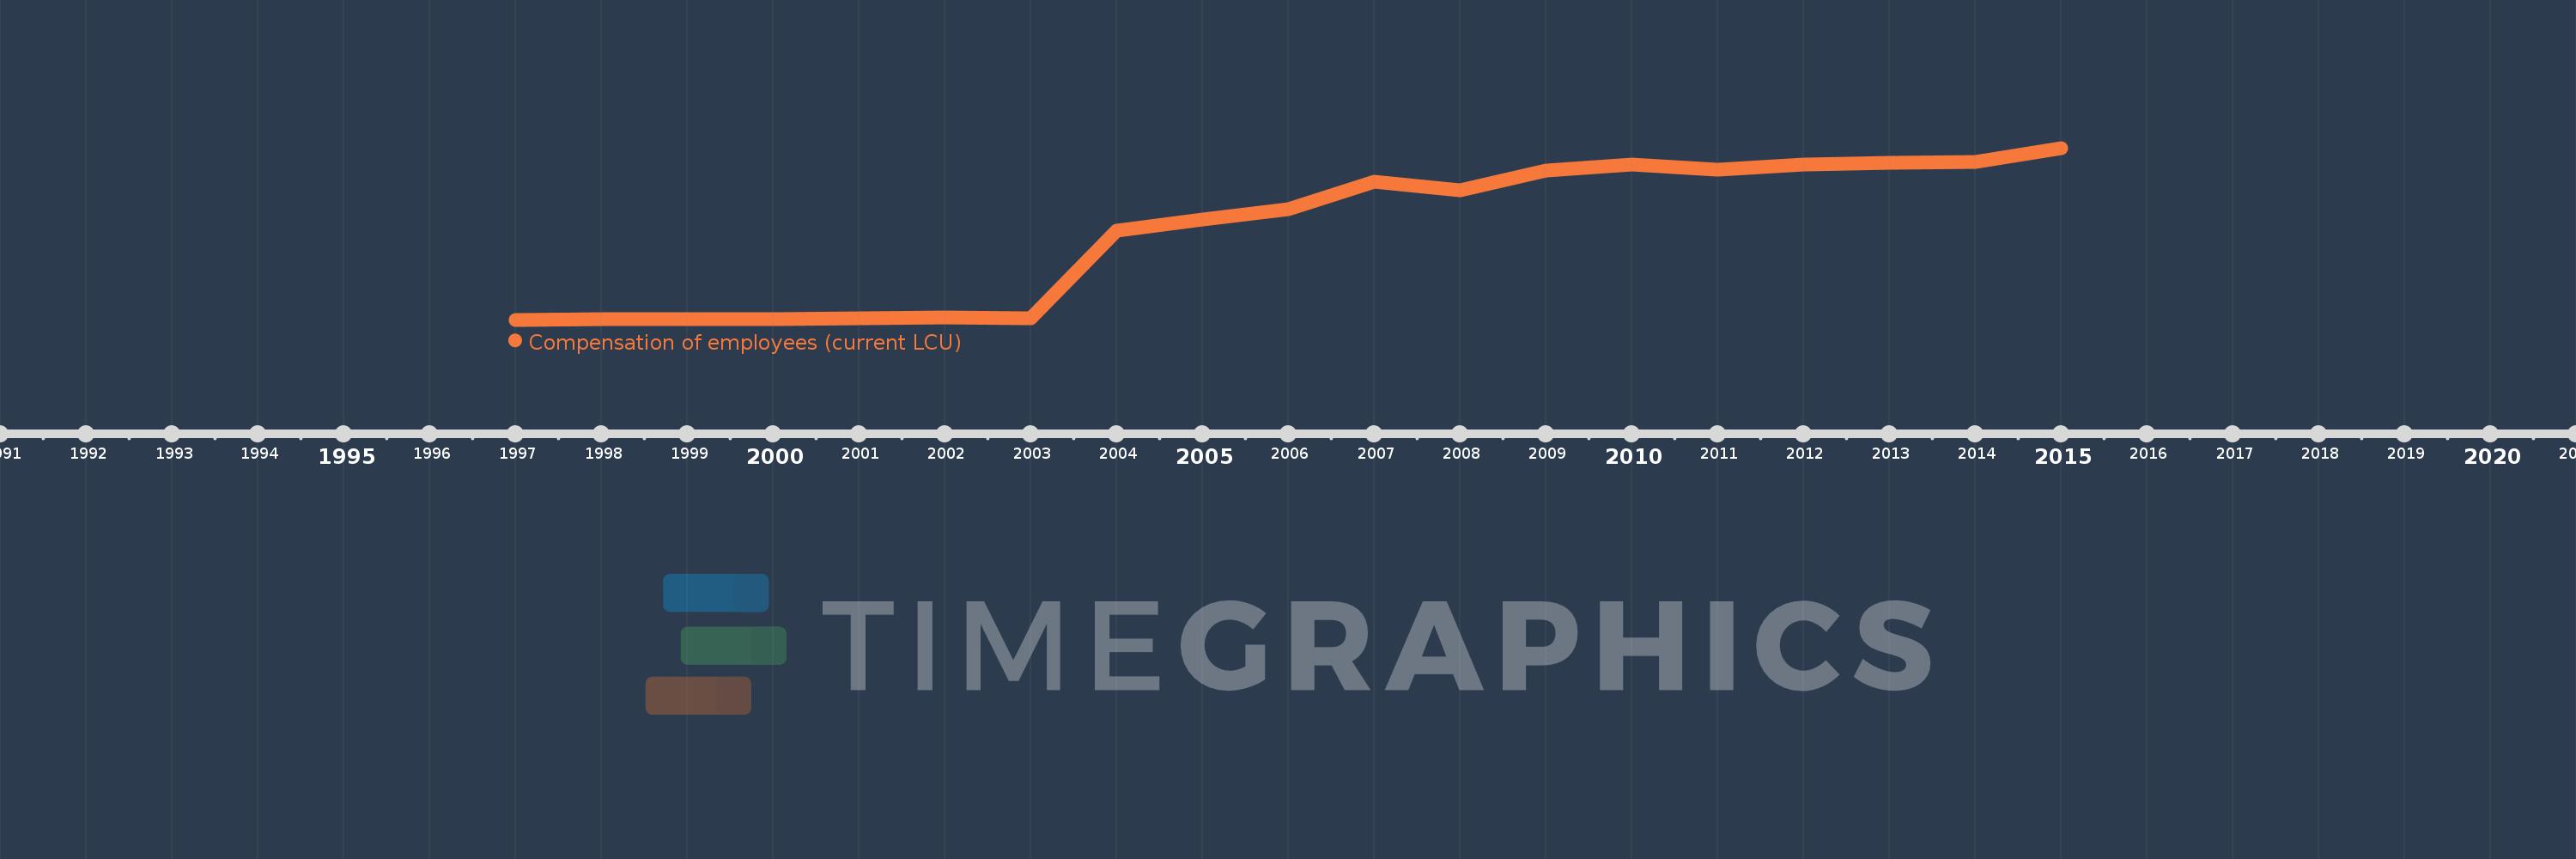
Cette échelle de temps montre un graphique de 1997 année à 2015 année Slovak Republic. Les données jusqu'à 1996 année ne sont pas présentés. Quantité d'observations actuelles selon dates: 19.
Source (désignation):
Les indicateurs du développement mondiale
Source (organisation):
International Monetary Fund, Government Finance Statistics Yearbook and data files.
Catégories:
Public Sector
Dernière mise à jour
23 avr. 2017
Les indicateurs de changement de valeurs selon les années
En moyenne:
1.318 mds
Minimum:
41.282 mln.
1 janv. 1997
Maximum:
2.537 mds
1 janv. 2015
Pour la date d''observation
Valeur
Changement absolu
Le changement par rapport à la valeur précédente
1 janv. 1997
41.282 mln.
+41.282 mln.
0.0%
1 janv. 1998
45.828 mln.
+4.545 mln.
11.01%
1 janv. 1999
50.184 mln.
+4.357 mln.
9.51%
1 janv. 2000
51.242 mln.
+1.058 mln.
2.11%
1 janv. 2001
68.296 mln.
+17.054 mln.
33.28%
1 janv. 2002
72.107 mln.
+3.811 mln.
5.58%
1 janv. 2003
63.187 mln.
-8.92 mln.
-12.37%
1 janv. 2004
1.337 mds
+1.273 mds
2.02 milles%
1 janv. 2005
1.492 mds
+155.646 mln.
11.65%
1 janv. 2006
1.647 mds
+154.883 mln.
10.38%
1 janv. 2007
2.05 mds
+403.306 mln.
24.49%
1 janv. 2008
1.919 mds
-131.787 mln.
-6.43%
1 janv. 2009
2.21 mds
+291.149 mln.
15.18%
1 janv. 2010
2.302 mds
+92.564 mln.
4.19%
1 janv. 2011
2.218 mds
-84.33 mln.
-3.66%
1 janv. 2012
2.292 mds
+73.839 mln.
3.33%
1 janv. 2013
2.315 mds
+23.651 mln.
1.03%
1 janv. 2014
2.337 mds
+21.768 mln.
0.94%
1 janv. 2015
2.537 mds
+200.248 mln.
8.57%
Classement des pays selon les statistiques actuelles par années