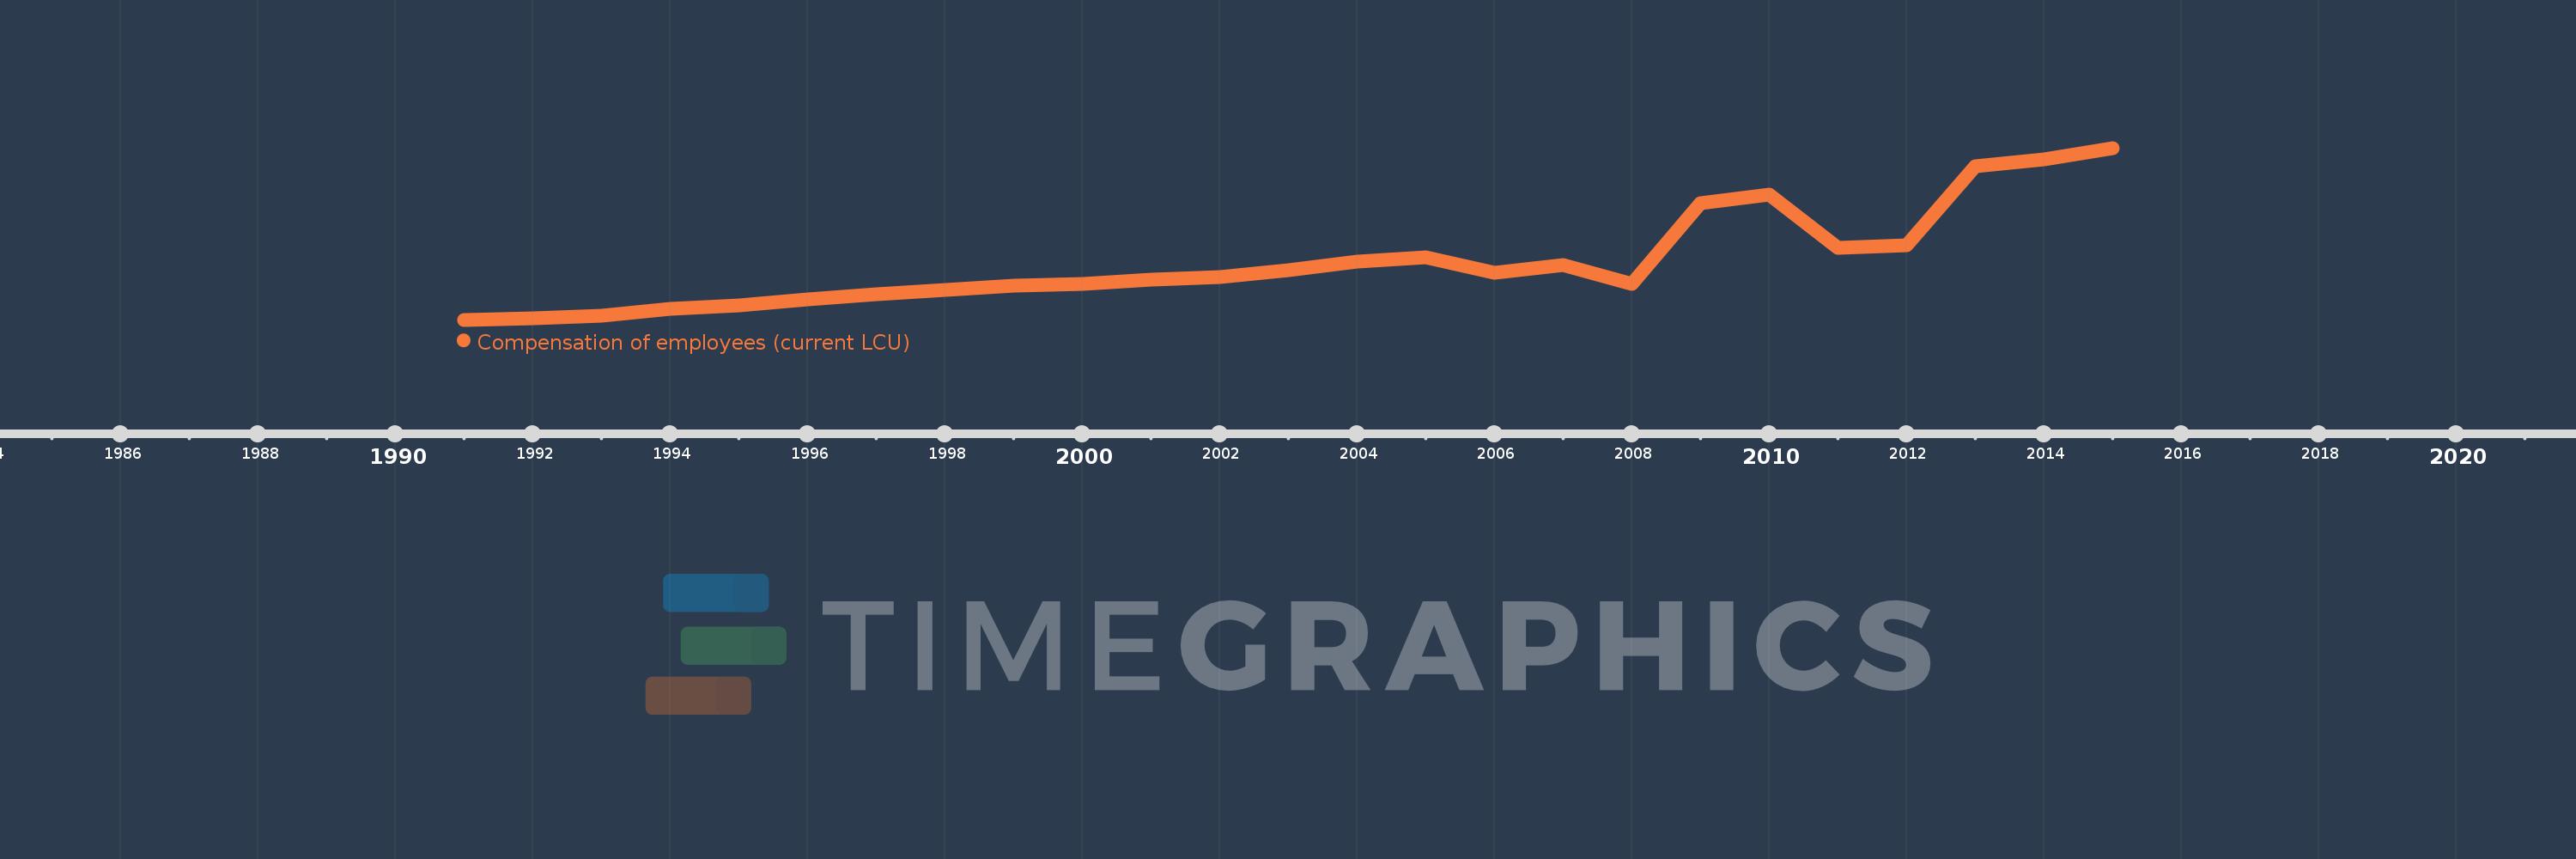
Cette échelle de temps montre un graphique de 1991 année à 2015 année Jordan. Les données jusqu'à 1990 année ne sont pas présentés. Quantité d'observations actuelles selon dates: 25.
Source (désignation):
Les indicateurs du développement mondiale
Source (organisation):
International Monetary Fund, Government Finance Statistics Yearbook and data files.
Catégories:
Public Sector
Dernière mise à jour
23 avr. 2017
Les indicateurs de changement de valeurs selon les années
En moyenne:
1.427 mds
Minimum:
488.94 mln.
1 janv. 1991
Maximum:
3.288 mds
1 janv. 2015
Pour la date d''observation
Valeur
Changement absolu
Le changement par rapport à la valeur précédente
1 janv. 1991
488.94 mln.
+488.94 mln.
0.0%
1 janv. 1992
511.39 mln.
+22.45 mln.
4.59%
1 janv. 1993
557.19 mln.
+45.8 mln.
8.96%
1 janv. 1994
668.42 mln.
+111.23 mln.
19.96%
1 janv. 1995
719.65 mln.
+51.23 mln.
7.66%
1 janv. 1996
823.2 mln.
+103.55 mln.
14.39%
1 janv. 1997
911.15 mln.
+87.95 mln.
10.68%
1 janv. 1998
972.46 mln.
+61.31 mln.
6.73%
1 janv. 1999
1.048 mds
+75.37 mln.
7.75%
1 janv. 2000
1.068 mds
+19.75 mln.
1.88%
1 janv. 2001
1.139 mds
+71.64 mln.
6.71%
1 janv. 2002
1.186 mds
+47.2 mln.
4.14%
1 janv. 2003
1.291 mds
+104.29 mln.
8.79%
1 janv. 2004
1.436 mds
+145.56 mln.
11.28%
1 janv. 2005
1.501 mds
+64.64 mln.
4.5%
1 janv. 2006
1.254 mds
-246.81 mln.
-16.44%
1 janv. 2007
1.383 mds
+128.72 mln.
10.26%
1 janv. 2008
1.068 mds
-315.12 mln.
-22.79%
1 janv. 2009
2.389 mds
+1.321 mds
123.71%
1 janv. 2010
2.533 mds
+144.4 mln.
6.05%
1 janv. 2011
1.655 mds
-877.7 mln.
-34.65%
1 janv. 2012
1.697 mds
+41.6 mln.
2.51%
1 janv. 2013
2.985 mds
+1.288 mds
75.93%
1 janv. 2014
3.099 mds
+113.5 mln.
3.8%
1 janv. 2015
3.288 mds
+188.9 mln.
6.1%
Classement des pays selon les statistiques actuelles par années