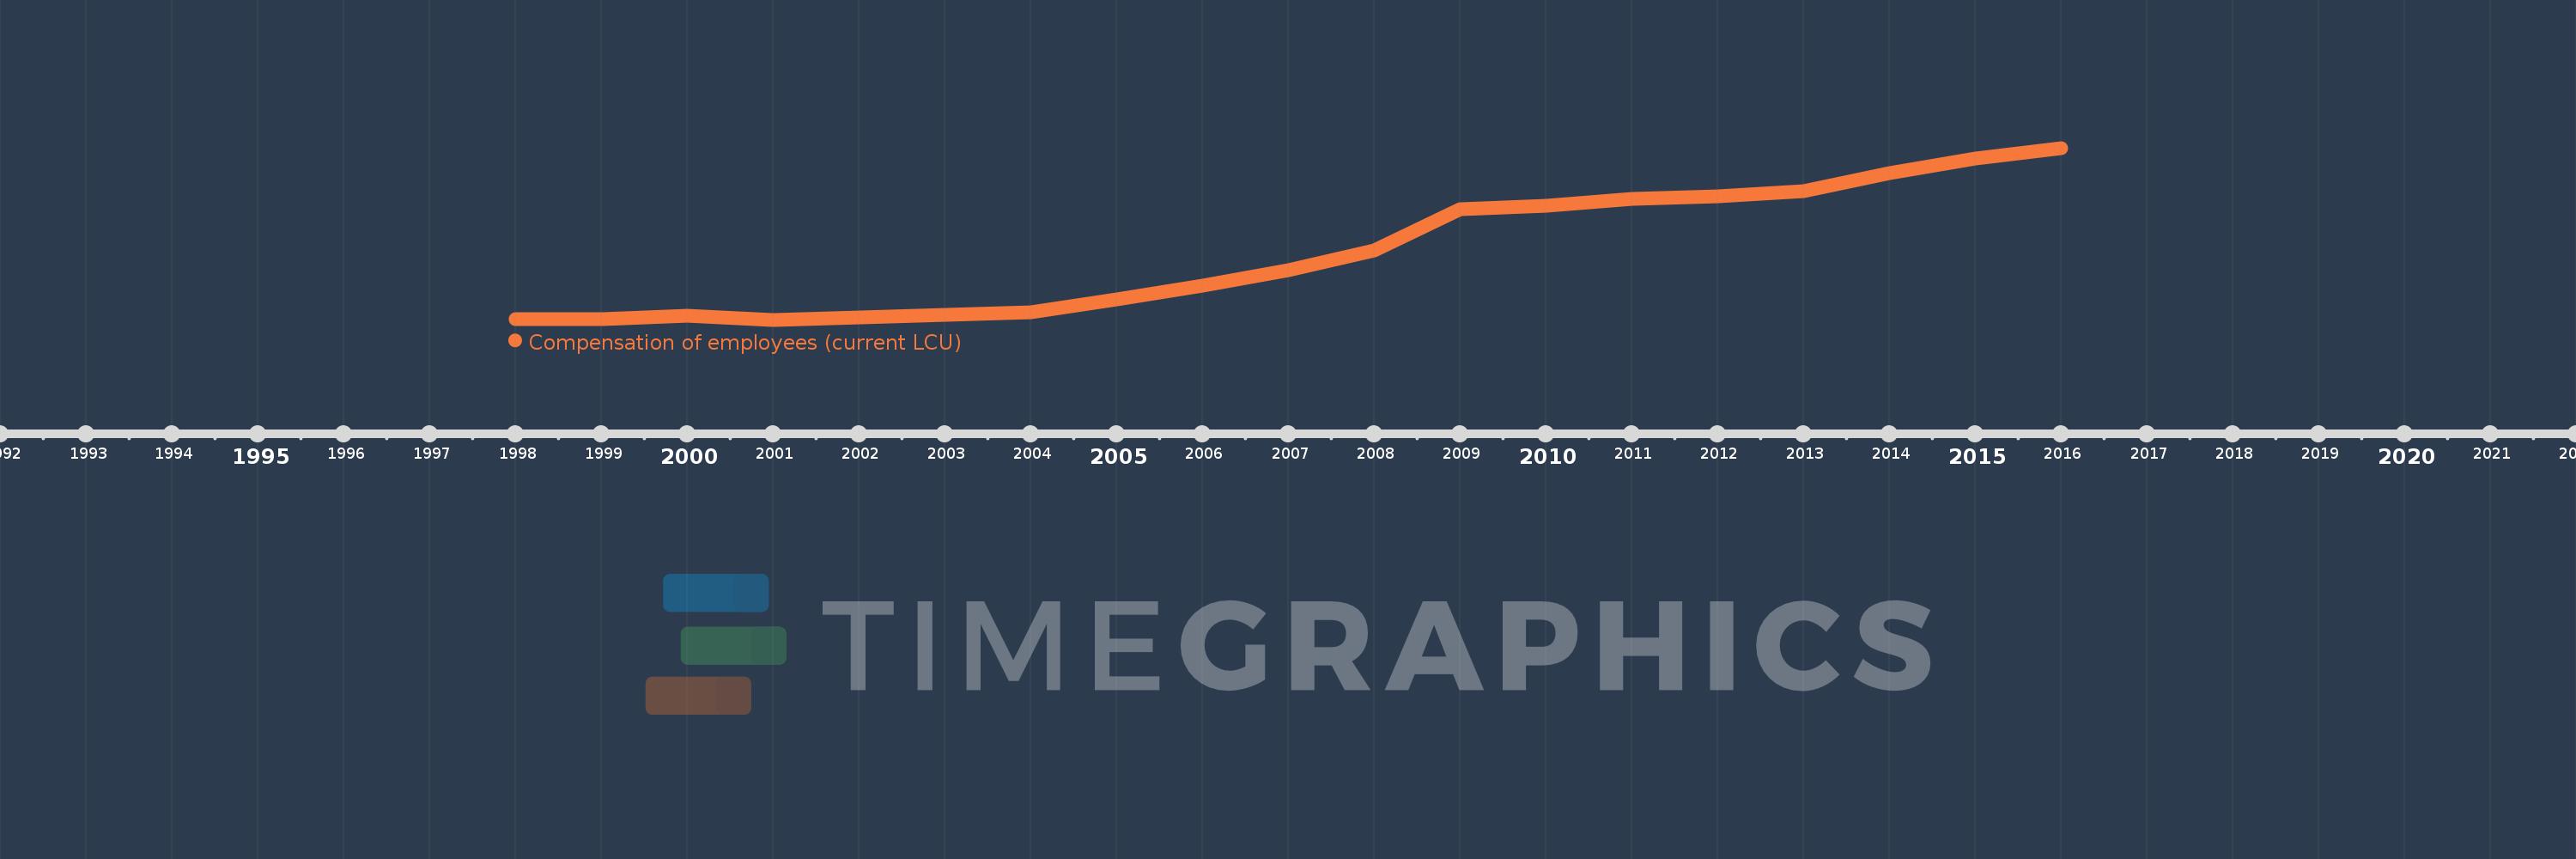
Cette échelle de temps montre un graphique de 1998 année à 2016 année Georgia. Les données jusqu'à 1997 année ne sont pas présentés. Quantité d'observations actuelles selon dates: 19.
Source (désignation):
Les indicateurs du développement mondiale
Source (organisation):
International Monetary Fund, Government Finance Statistics Yearbook and data files.
Catégories:
Public Sector
Dernière mise à jour
23 avr. 2017
Les indicateurs de changement de valeurs selon les années
En moyenne:
583.147 mln.
Minimum:
76.8 mln.
1 janv. 2001
Maximum:
1.377 mds
1 janv. 2016
Pour la date d''observation
Valeur
Changement absolu
Le changement par rapport à la valeur précédente
1 janv. 1998
79.1 mln.
+79.1 mln.
0.0%
1 janv. 1999
80.4 mln.
+1.3 mln.
1.64%
1 janv. 2000
107.2 mln.
+26.8 mln.
33.33%
1 janv. 2001
76.8 mln.
-30.4 mln.
-28.36%
1 janv. 2002
97.4 mln.
+20.6 mln.
26.82%
1 janv. 2003
112.0 mln.
+14.6 mln.
14.99%
1 janv. 2004
131.5 mln.
+19.5 mln.
17.41%
1 janv. 2005
233.0 mln.
+101.5 mln.
77.19%
1 janv. 2006
336.7 mln.
+103.7 mln.
44.51%
1 janv. 2007
451.5 mln.
+114.8 mln.
34.1%
1 janv. 2008
603.5 mln.
+152.0 mln.
33.67%
1 janv. 2009
913.1 mln.
+309.6 mln.
51.3%
1 janv. 2010
941.6 mln.
+28.5 mln.
3.12%
1 janv. 2011
993.5 mln.
+51.9 mln.
5.51%
1 janv. 2012
1.012 mds
+19.0 mln.
1.91%
1 janv. 2013
1.049 mds
+36.9 mln.
3.64%
1 janv. 2014
1.188 mds
+138.2 mln.
13.17%
1 janv. 2015
1.296 mds
+108.6 mln.
9.14%
1 janv. 2016
1.377 mds
+80.6 mln.
6.22%
Classement des pays selon les statistiques actuelles par années