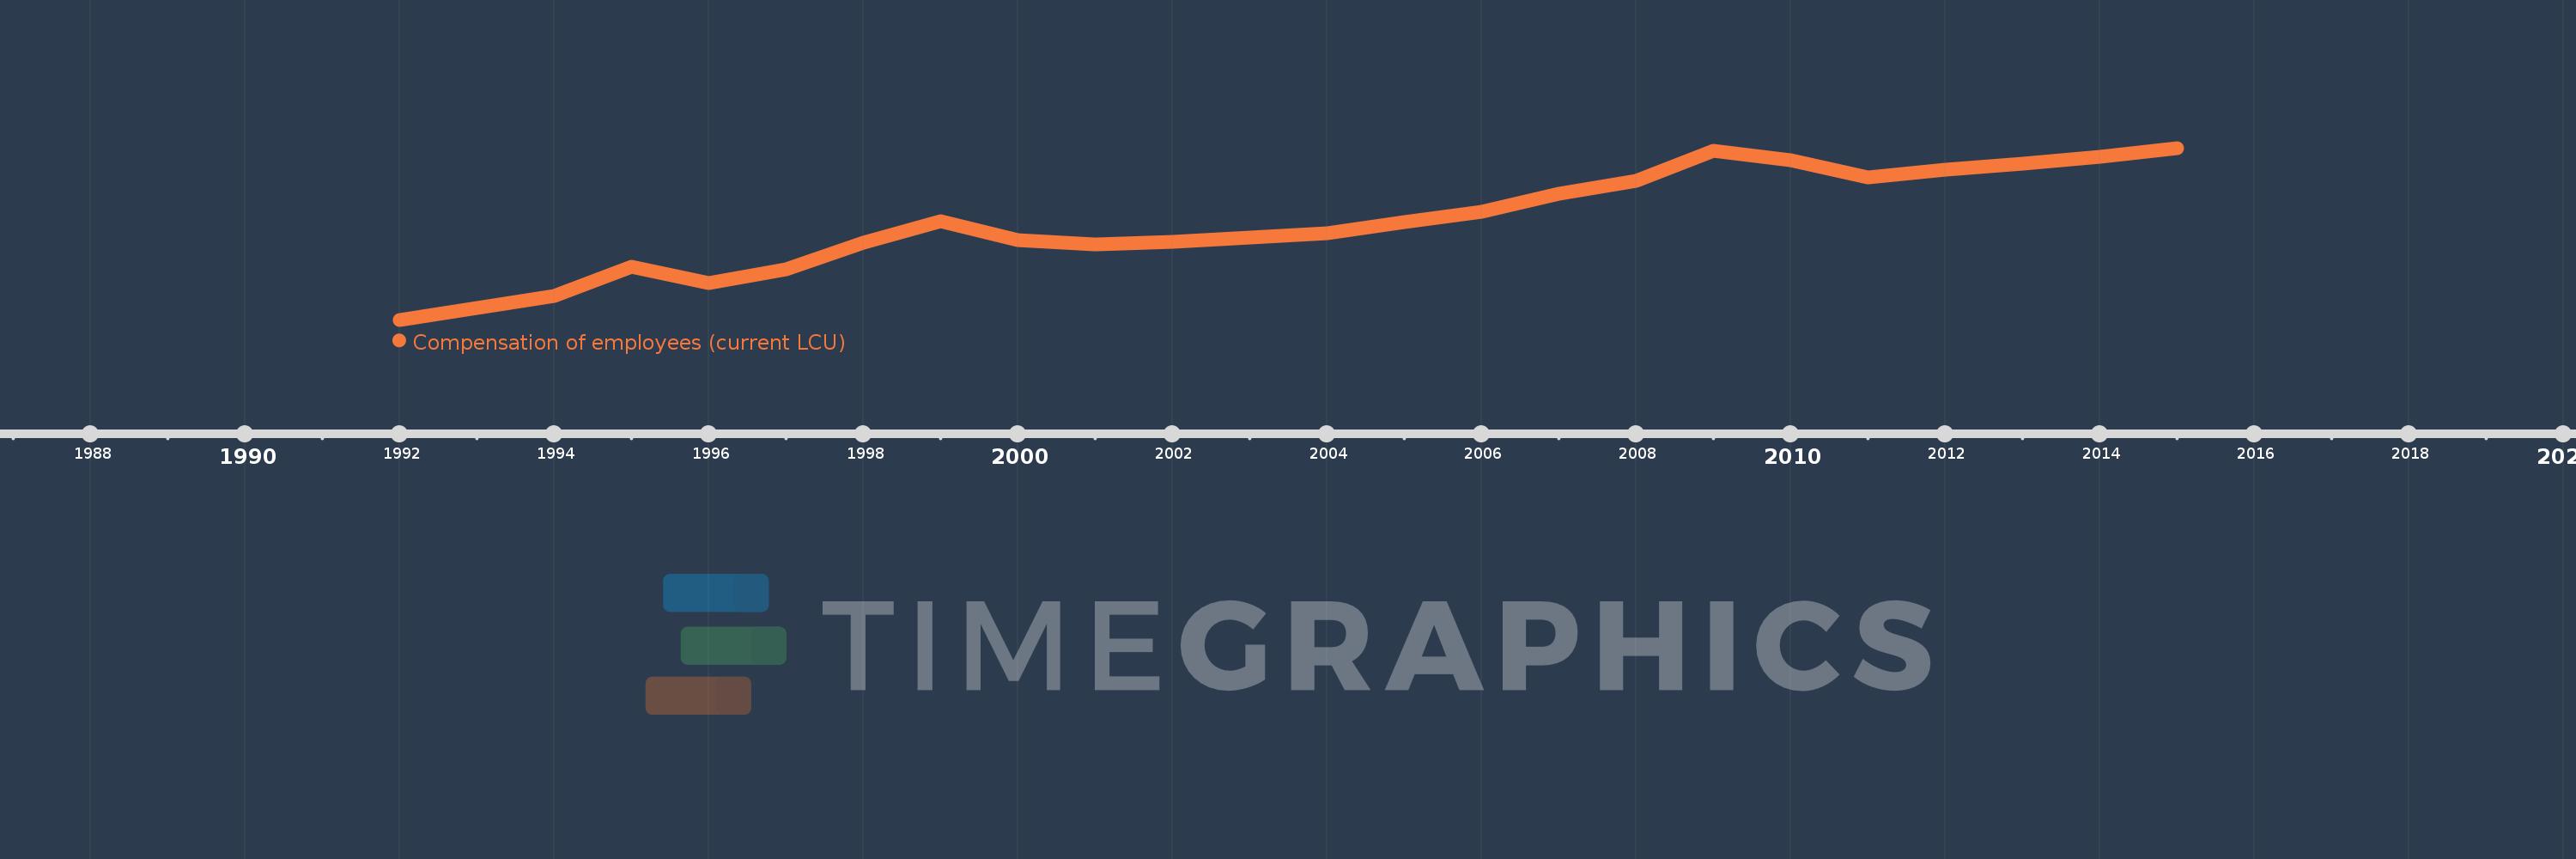
Cette échelle de temps montre un graphique de 1992 année à 2015 année Lithuania. Les données jusqu'à 1991 année ne sont pas présentés. Quantité d'observations actuelles selon dates: 23.
Source (désignation):
Les indicateurs du développement mondiale
Source (organisation):
International Monetary Fund, Government Finance Statistics Yearbook and data files.
Catégories:
Public Sector
Dernière mise à jour
23 avr. 2017
Les indicateurs de changement de valeurs selon les années
En moyenne:
333.3 mln.
Minimum:
2.16 mln.
1 janv. 1992
Maximum:
565.518 mln.
1 janv. 2015
Pour la date d''observation
Valeur
Changement absolu
Le changement par rapport à la valeur précédente
1 janv. 1992
2.16 mln.
+2.16 mln.
0.0%
1 janv. 1994
78.864 mln.
+76.704 mln.
3.55 milles%
1 janv. 1995
176.639 mln.
+97.776 mln.
123.98%
1 janv. 1996
122.411 mln.
-54.228 mln.
-30.7%
1 janv. 1997
167.134 mln.
+44.723 mln.
36.54%
1 janv. 1998
255.917 mln.
+88.783 mln.
53.12%
1 janv. 1999
324.073 mln.
+68.156 mln.
26.63%
1 janv. 2000
263.044 mln.
-61.029 mln.
-18.83%
1 janv. 2001
247.828 mln.
-15.217 mln.
-5.78%
1 janv. 2002
256.948 mln.
+9.12 mln.
3.68%
1 janv. 2003
271.794 mln.
+14.846 mln.
5.78%
1 janv. 2004
286.608 mln.
+14.814 mln.
5.45%
1 janv. 2005
321.278 mln.
+34.67 mln.
12.1%
1 janv. 2006
356.647 mln.
+35.368 mln.
11.01%
1 janv. 2007
415.193 mln.
+58.547 mln.
16.42%
1 janv. 2008
458.468 mln.
+43.275 mln.
10.42%
1 janv. 2009
557.336 mln.
+98.868 mln.
21.56%
1 janv. 2010
525.078 mln.
-32.258 mln.
-5.79%
1 janv. 2011
469.318 mln.
-55.761 mln.
-10.62%
1 janv. 2012
493.145 mln.
+23.827 mln.
5.08%
1 janv. 2013
512.651 mln.
+19.506 mln.
3.96%
1 janv. 2014
537.848 mln.
+25.197 mln.
4.92%
1 janv. 2015
565.518 mln.
+27.67 mln.
5.14%
Classement des pays selon les statistiques actuelles par années