33
/es/
AIzaSyAYiBZKx7MnpbEhh9jyipgxe19OcubqV5w
August 1, 2025
98657
Cambodia
KHM
true
2
1
Gross fixed capital formation, private sector (% of GDP)
2012,2011,2010,2009,2008,2007,2006,2005,2004,2003,2002,2001,2000,1999,1998,1997,1996,1995,1994
Download
Estadísticas Globales de la Biblioteca →Cambodia →

Gross fixed capital formation, private sector (% of GDP)

Estas estadísticas en otros países:

AlbaniaAlgeriaAngolaAntigua and BarbudaArmeniaAustraliaAzerbaijanBangladeshBarbadosBelarusBelizeBeninBhutanBoliviaBosnia and HerzegovinaBotswanaBrazilBulgariaBurkina FasoBurundiCabo VerdeCambodiaCameroonCaribbean small statesCentral African RepublicChadColombiaComorosCongo, Dem. Rep.Congo, Rep.Costa RicaCote d'IvoireCroatiaDjiboutiDominicaDominican RepublicEarly-demographic dividendEcuadorEgypt, Arab Rep.El SalvadorEquatorial GuineaEritreaEthiopiaEurope & Central Asia (excluding high income)Europe & Central Asia (IDA & IBRD countries)FijiGabonGambia, TheGeorgiaGhanaGrenadaGuatemalaGuineaGuinea-BissauGuyanaHaitiHeavily indebted poor countries (HIPC)HondurasHong Kong SAR, ChinaIDA onlyIndiaIran, Islamic Rep.IraqJamaicaJapanJordanKazakhstanKenyaKosovoKyrgyz RepublicLao PDRLatin America & Caribbean Latin America & Caribbean (excluding high income)Latin America & the Caribbean (IDA & IBRD countries)Least developed countries: UN classificationLebanonLesothoLiberiaLibyaLow incomeLower middle incomeMacedonia, FYRMadagascarMalawiMalaysiaMaliMauritaniaMauritiusMexicoMiddle East & North Africa (excluding high income)Middle East & North Africa (IDA & IBRD countries)MoldovaMongoliaMontenegroMozambiqueNamibiaNepalNicaraguaNigerNorth AmericaOmanPakistanPanamaPapua New GuineaParaguayPeruPhilippinesRomaniaRussian FederationRwandaSenegalSerbiaSeychellesSierra LeoneSouth AfricaSouth AsiaSouth Asia (IDA & IBRD)South SudanSri LankaSt. Kitts and NevisSt. LuciaSt. Vincent and the GrenadinesSub-Saharan Africa Sub-Saharan Africa (excluding high income)Sub-Saharan Africa (IDA & IBRD countries)SudanSurinameSwazilandSyrian Arab RepublicTajikistanTanzaniaThailandTimor-LesteTogoTrinidad and TobagoTunisiaTurkeyTurkmenistanUgandaUkraineUnited Arab EmiratesUnited StatesUruguayUzbekistanVenezuela, RBYemen, Rep.Zimbabwe

línea de tiempo (timeline):

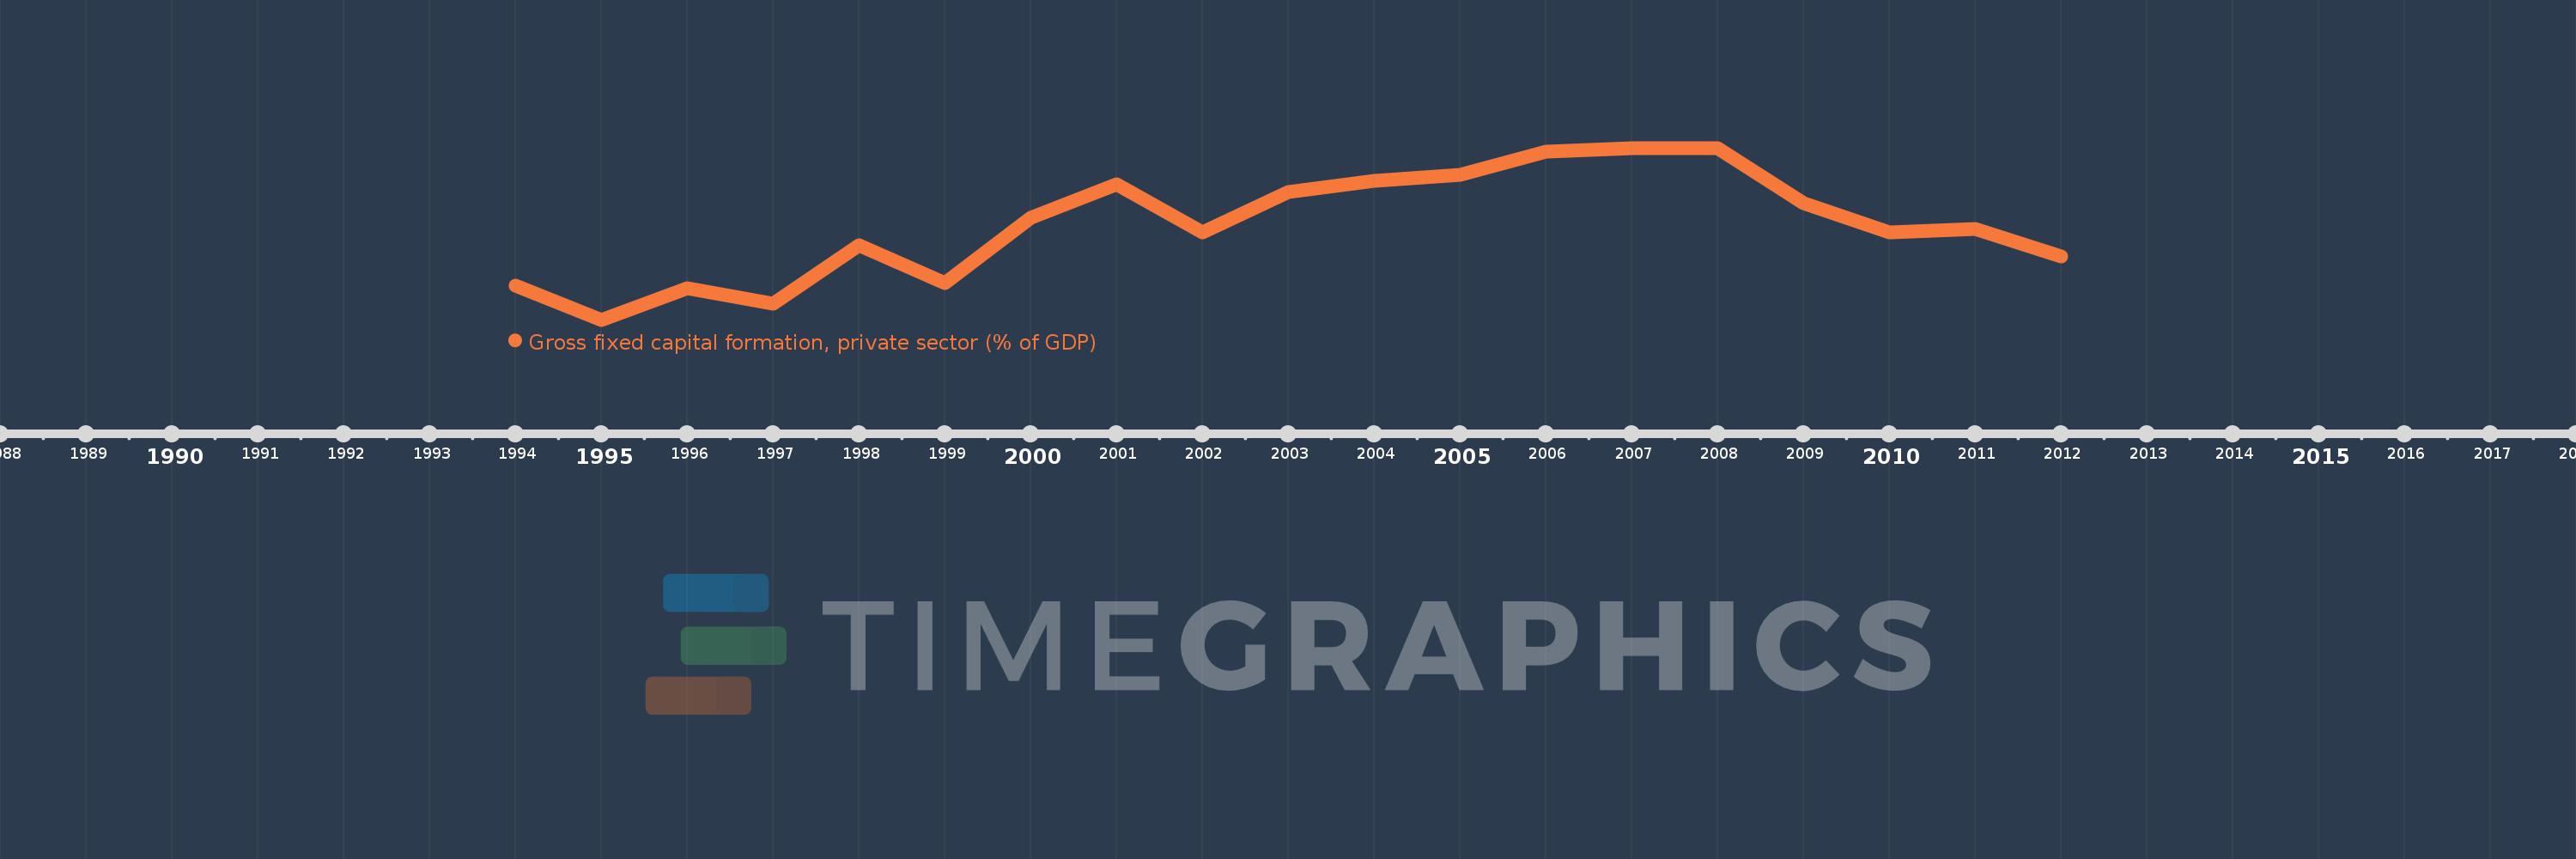
En esta escala de tiempo se presenta un gráfico de 1994 y 2012 de Cambodia. Los datos de 1993 están ausentes. El número de observaciones reales por fecha: 19.

Fuente (nombre):

Indicadores del desarrollo mundial

Fuente (organización):

World Bank national accounts data, and OECD National Accounts data files.

Categorías:

Economy & Growth

Se ha actualizado:

23 abr 2017 año

Los indicadores de los cambios de valor en los últimos años

En promedio:
9.911
Mínimo:
5.291
1 ene 1995 año
Máximo:
13.671
1 ene 2008 año
A la fecha de observación
Valor
Cambio absoluto
El cambio con respecto al valor anterior
1 ene 1994 año
6.962
+6.962
0.0%
1 ene 1995 año
5.291
-1.671
-24.01%
1 ene 1996 año
6.817
+1.526
28.84%
1 ene 1997 año
6.076
-0.741
-10.87%
1 ene 1998 año
8.92
+2.844
46.8%
1 ene 1999 año
7.086
-1.833
-20.55%
1 ene 2000 año
10.279
+3.193
45.05%
1 ene 2001 año
11.91
+1.632
15.87%
1 ene 2002 año
9.546
-2.365
-19.86%
1 ene 2003 año
11.54
+1.994
20.89%
1 ene 2004 año
12.081
+0.541
4.69%
1 ene 2005 año
12.367
+0.286
2.37%
1 ene 2006 año
13.5
+1.133
9.16%
1 ene 2007 año
13.646
+0.146
1.08%
1 ene 2008 año
13.671
+0.025
0.18%
1 ene 2009 año
10.967
-2.704
-19.78%
1 ene 2010 año
9.56
-1.408
-12.84%
1 ene 2011 año
9.716
+0.157
1.64%
1 ene 2012 año
8.372
-1.345
-13.84%

Ranking de los países por los datos estadísticos actuales