33
/es/
AIzaSyAYiBZKx7MnpbEhh9jyipgxe19OcubqV5w
August 1, 2025
166211
Kazakhstan
KAZ
true
2
1
Gross fixed capital formation, private sector (% of GDP)
2007,2006,2005,2004,2003,2002,2001,2000,1999,1998,1997,1996,1995,1994,1993
Download
Estadísticas Globales de la Biblioteca →Kazakhstan →

Gross fixed capital formation, private sector (% of GDP)

Estas estadísticas en otros países:

AlbaniaAlgeriaAngolaAntigua and BarbudaArmeniaAustraliaAzerbaijanBangladeshBarbadosBelarusBelizeBeninBhutanBoliviaBosnia and HerzegovinaBotswanaBrazilBulgariaBurkina FasoBurundiCabo VerdeCambodiaCameroonCaribbean small statesCentral African RepublicChadColombiaComorosCongo, Dem. Rep.Congo, Rep.Costa RicaCote d'IvoireCroatiaDjiboutiDominicaDominican RepublicEarly-demographic dividendEcuadorEgypt, Arab Rep.El SalvadorEquatorial GuineaEritreaEthiopiaEurope & Central Asia (excluding high income)Europe & Central Asia (IDA & IBRD countries)FijiGabonGambia, TheGeorgiaGhanaGrenadaGuatemalaGuineaGuinea-BissauGuyanaHaitiHeavily indebted poor countries (HIPC)HondurasHong Kong SAR, ChinaIDA onlyIndiaIran, Islamic Rep.IraqJamaicaJapanJordanKazakhstanKenyaKosovoKyrgyz RepublicLao PDRLatin America & Caribbean Latin America & Caribbean (excluding high income)Latin America & the Caribbean (IDA & IBRD countries)Least developed countries: UN classificationLebanonLesothoLiberiaLibyaLow incomeLower middle incomeMacedonia, FYRMadagascarMalawiMalaysiaMaliMauritaniaMauritiusMexicoMiddle East & North Africa (excluding high income)Middle East & North Africa (IDA & IBRD countries)MoldovaMongoliaMontenegroMozambiqueNamibiaNepalNicaraguaNigerNorth AmericaOmanPakistanPanamaPapua New GuineaParaguayPeruPhilippinesRomaniaRussian FederationRwandaSenegalSerbiaSeychellesSierra LeoneSouth AfricaSouth AsiaSouth Asia (IDA & IBRD)South SudanSri LankaSt. Kitts and NevisSt. LuciaSt. Vincent and the GrenadinesSub-Saharan Africa Sub-Saharan Africa (excluding high income)Sub-Saharan Africa (IDA & IBRD countries)SudanSurinameSwazilandSyrian Arab RepublicTajikistanTanzaniaThailandTimor-LesteTogoTrinidad and TobagoTunisiaTurkeyTurkmenistanUgandaUkraineUnited Arab EmiratesUnited StatesUruguayUzbekistanVenezuela, RBYemen, Rep.Zimbabwe

línea de tiempo (timeline):

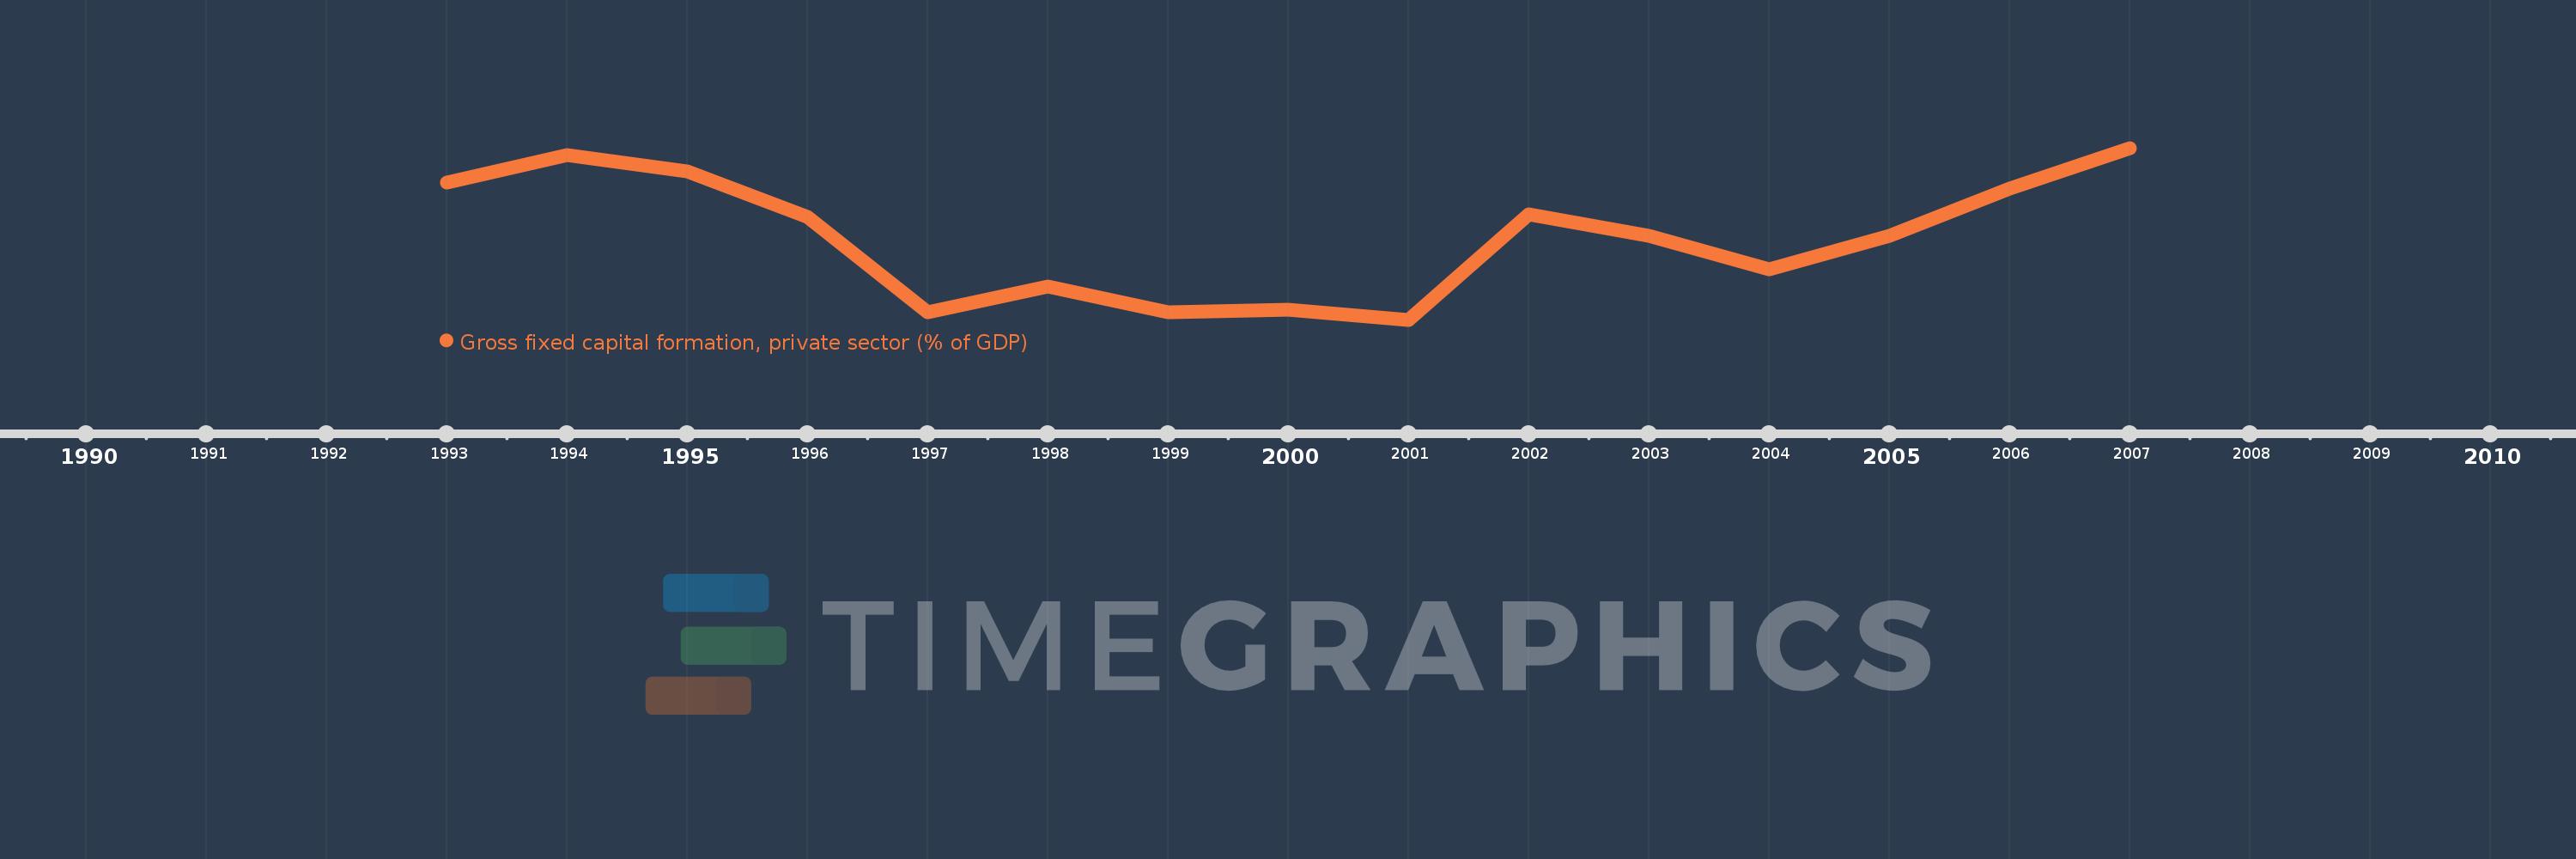
En esta escala de tiempo se presenta un gráfico de 1993 y 2007 de Kazakhstan. Los datos de 1992 están ausentes. El número de observaciones reales por fecha: 15.

Fuente (nombre):

Indicadores del desarrollo mundial

Fuente (organización):

World Bank national accounts data, and OECD National Accounts data files.

Categorías:

Economy & Growth

Se ha actualizado:

23 abr 2017 año

Los indicadores de los cambios de valor en los últimos años

En promedio:
20.63
Mínimo:
15.96
1 ene 2001 año
Máximo:
25.675
1 ene 2007 año
A la fecha de observación
Valor
Cambio absoluto
El cambio con respecto al valor anterior
1 ene 1993 año
23.715
+23.715
0.0%
1 ene 1994 año
25.27
+1.555
6.56%
1 ene 1995 año
24.371
-0.899
-3.56%
1 ene 1996 año
21.798
-2.572
-10.55%
1 ene 1997 año
16.397
-5.401
-24.78%
1 ene 1998 año
17.834
+1.437
8.77%
1 ene 1999 año
16.382
-1.452
-8.14%
1 ene 2000 año
16.505
+0.123
0.75%
1 ene 2001 año
15.96
-0.546
-3.31%
1 ene 2002 año
21.919
+5.959
37.34%
1 ene 2003 año
20.715
-1.204
-5.49%
1 ene 2004 año
18.827
-1.888
-9.11%
1 ene 2005 año
20.691
+1.865
9.91%
1 ene 2006 año
23.395
+2.704
13.07%
1 ene 2007 año
25.675
+2.28
9.75%

Ranking de los países por los datos estadísticos actuales