33
/es/
AIzaSyB4mHJ5NPEv-XzF7P6NDYXjlkCWaeKw5bc
November 30, 2025
59832
Sub-Saharan Africa (excluding high income)
SSA
false
2
1
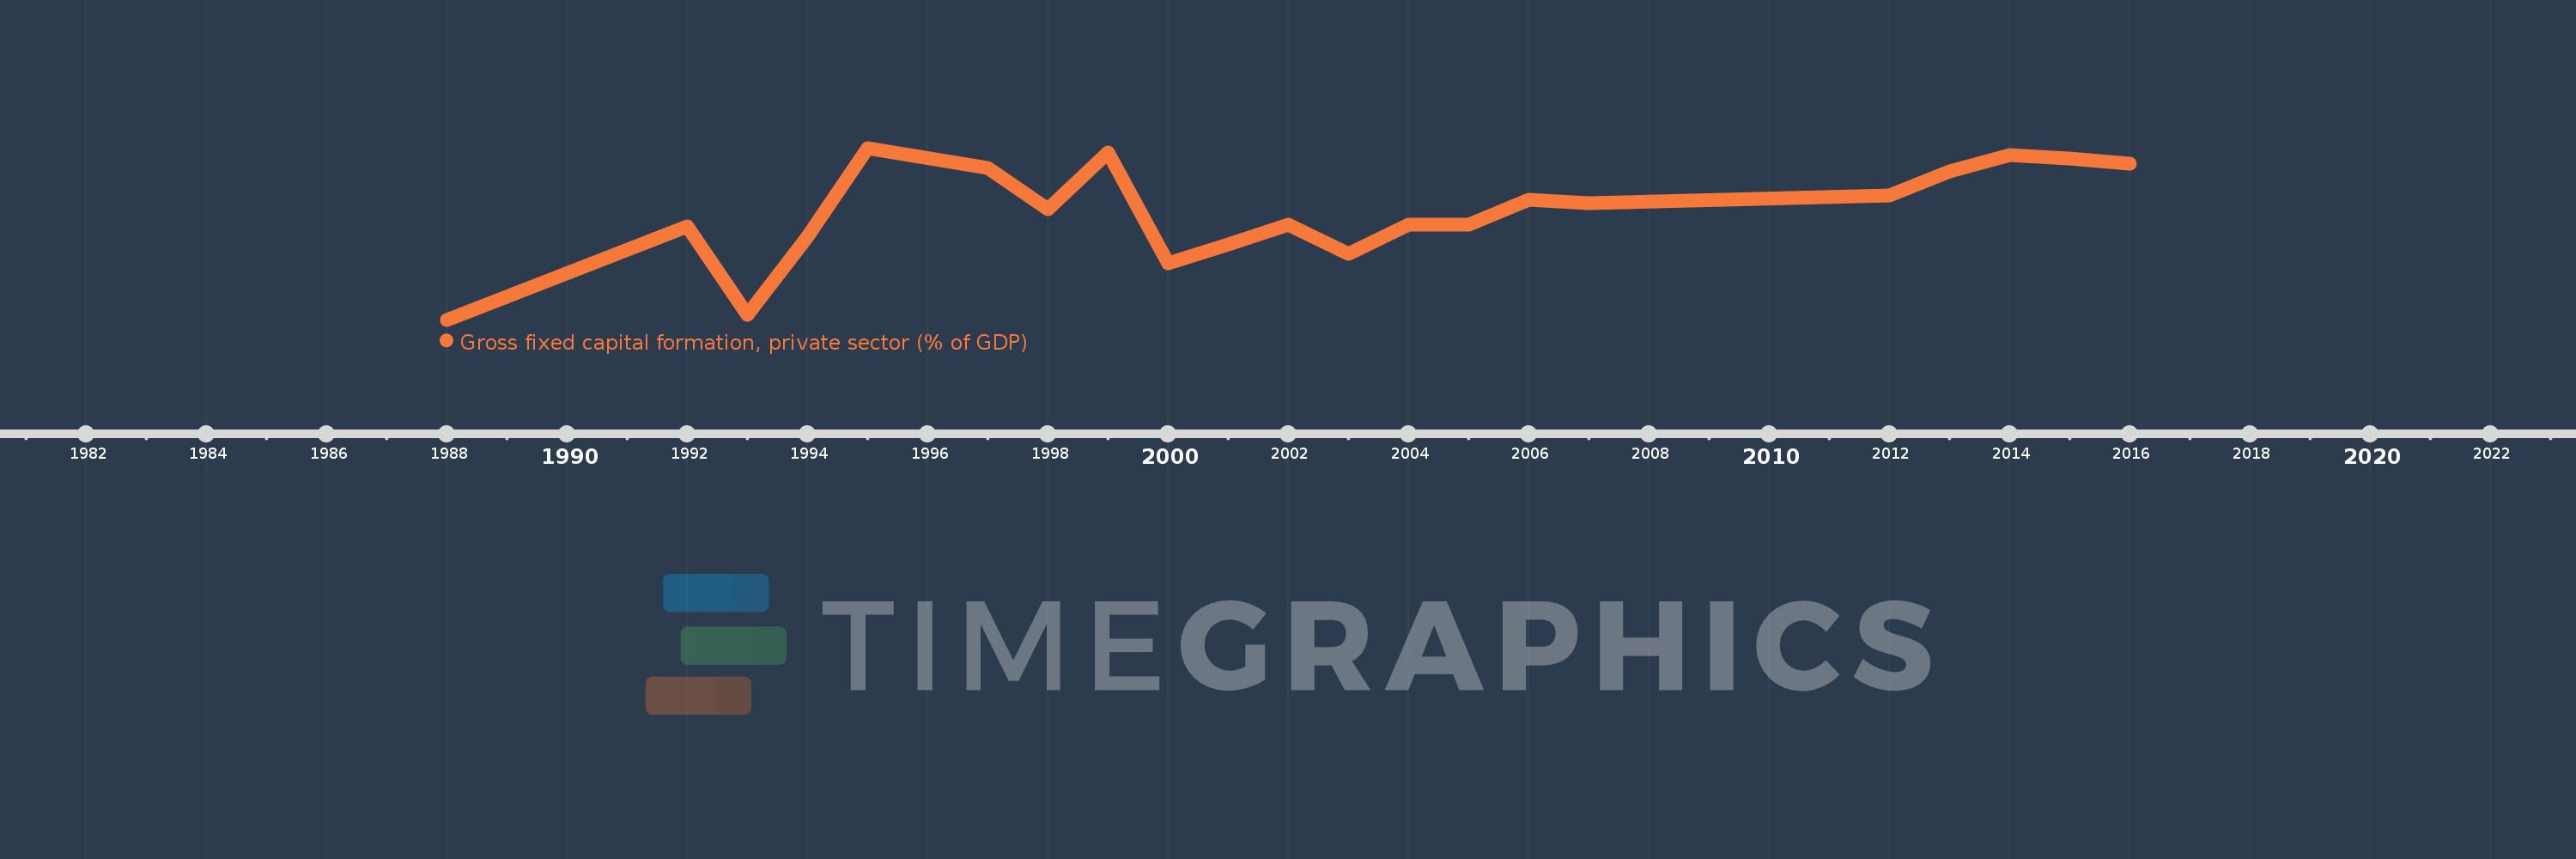
Gross fixed capital formation, private sector (% of GDP)
2016,2015,2014,2013,2012,2007,2006,2005,2004,2003,2002,2001,2000,1999,1998,1997,1995,1994,1993,1992,1988