29
/es/
es
AIzaSyAYiBZKx7MnpbEhh9jyipgxe19OcubqV5w
April 1, 2024
250832
St. Lucia
LCA
true
2
1
Gross fixed capital formation, private sector (% of GDP)
2000,1999,1998,1997,1996,1995,1994,1993,1992,1991,1990,1989,1988,1987,1986,1985,1984,1983,1982,1981
Download
Estadísticas Globales de la Biblioteca →St. Lucia →

Gross fixed capital formation, private sector (% of GDP)

Estas estadísticas en otros países:
AlbaniaAlgeriaAngolaAntigua and BarbudaArmeniaAustraliaAzerbaijanBangladeshBarbadosBelarusBelizeBeninBhutanBoliviaBosnia and HerzegovinaBotswanaBrazilBulgariaBurkina FasoBurundiCabo VerdeCambodiaCameroonCaribbean small statesCentral African RepublicChadColombiaComorosCongo, Dem. Rep.Congo, Rep.Costa RicaCote d'IvoireCroatiaDjiboutiDominicaDominican RepublicEarly-demographic dividendEcuadorEgypt, Arab Rep.El SalvadorEquatorial GuineaEritreaEthiopiaEurope & Central Asia (excluding high income)Europe & Central Asia (IDA & IBRD countries)FijiGabonGambia, TheGeorgiaGhanaGrenadaGuatemalaGuineaGuinea-BissauGuyanaHaitiHeavily indebted poor countries (HIPC)HondurasHong Kong SAR, ChinaIDA onlyIndiaIran, Islamic Rep.IraqJamaicaJapanJordanKazakhstanKenyaKosovoKyrgyz RepublicLao PDRLatin America & Caribbean Latin America & Caribbean (excluding high income)Latin America & the Caribbean (IDA & IBRD countries)Least developed countries: UN classificationLebanonLesothoLiberiaLibyaLow incomeLower middle incomeMacedonia, FYRMadagascarMalawiMalaysiaMaliMauritaniaMauritiusMexicoMiddle East & North Africa (excluding high income)Middle East & North Africa (IDA & IBRD countries)MoldovaMongoliaMontenegroMozambiqueNamibiaNepalNicaraguaNigerNorth AmericaOmanPakistanPanamaPapua New GuineaParaguayPeruPhilippinesRomaniaRussian FederationRwandaSenegalSerbiaSeychellesSierra LeoneSouth AfricaSouth AsiaSouth Asia (IDA & IBRD)South SudanSri LankaSt. Kitts and NevisSt. LuciaSt. Vincent and the GrenadinesSub-Saharan Africa Sub-Saharan Africa (excluding high income)Sub-Saharan Africa (IDA & IBRD countries)SudanSurinameSwazilandSyrian Arab RepublicTajikistanTanzaniaThailandTimor-LesteTogoTrinidad and TobagoTunisiaTurkeyTurkmenistanUgandaUkraineUnited Arab EmiratesUnited StatesUruguayUzbekistanVenezuela, RBYemen, Rep.Zimbabwe
línea de tiempo (timeline):
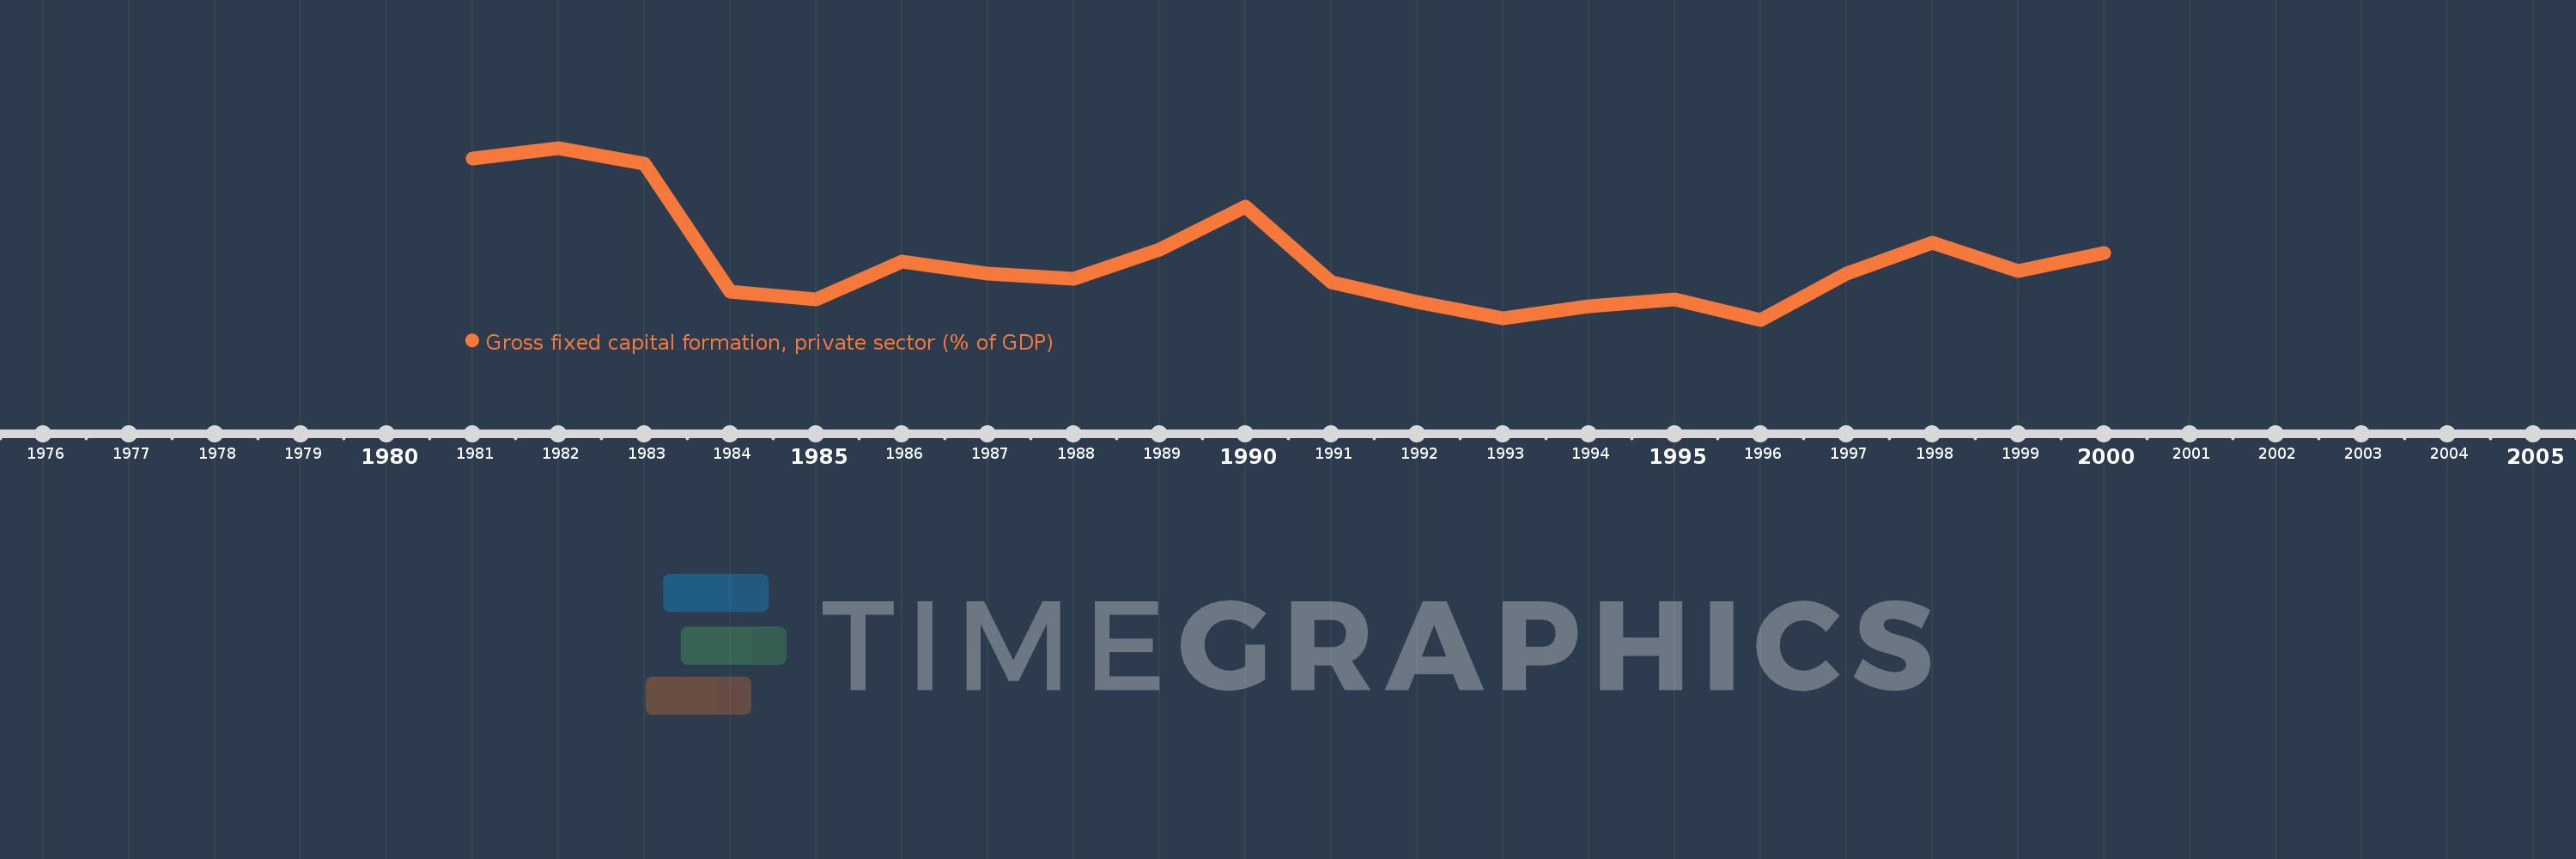
En esta escala de tiempo se presenta un gráfico de 1981 y 2000 de St. Lucia. Los datos de 1980 están ausentes. El número de observaciones reales por fecha: 20.
Fuente (nombre):
Indicadores del desarrollo mundial
Fuente (organización):
World Bank national accounts data, and OECD National Accounts data files.
Categorías:
Economy & Growth
Se ha actualizado:
23 abr 2017 año
Los indicadores de los cambios de valor en los últimos años
En promedio:
15.874
Mínimo:
10.399
1 ene 1996 año
Máximo:
26.12
1 ene 1982 año
A la fecha de observación
Valor
Cambio absoluto
El cambio con respecto al valor anterior
1 ene 1981 año
25.121
+25.121
0.0%
1 ene 1982 año
26.12
+1.0
3.98%
1 ene 1983 año
24.692
-1.428
-5.47%
1 ene 1984 año
12.988
-11.705
-47.4%
1 ene 1985 año
12.262
-0.726
-5.59%
1 ene 1986 año
15.74
+3.478
28.36%
1 ene 1987 año
14.585
-1.155
-7.34%
1 ene 1988 año
14.13
-0.455
-3.12%
1 ene 1989 año
16.823
+2.694
19.07%
1 ene 1990 año
20.732
+3.908
23.23%
1 ene 1991 año
13.809
-6.923
-33.39%
1 ene 1992 año
12.048
-1.761
-12.75%
1 ene 1993 año
10.569
-1.48
-12.28%
1 ene 1994 año
11.642
+1.073
10.16%
1 ene 1995 año
12.3
+0.658
5.65%
1 ene 1996 año
10.399
-1.902
-15.46%
1 ene 1997 año
14.609
+4.21
40.49%
1 ene 1998 año
17.476
+2.868
19.63%
1 ene 1999 año
14.893
-2.583
-14.78%
1 ene 2000 año
16.542
+1.649
11.07%
Ranking de los países por los datos estadísticos actuales

Comentarios:

Enviar
PremiumAbout & FeedbackAcuerdoPrivacidad
logo
© 2022 Selected Technologies LLC – Morgan Hill, California