29
/es/
es
AIzaSyAYiBZKx7MnpbEhh9jyipgxe19OcubqV5w
April 1, 2024
96463
Burundi
BDI
true
2
1
Net current transfers from abroad (current LCU)
2016,2015,2014,2013,2012,2011,2010,2009,2008,2007,2006,2005,2004,2003,2002,2001,2000,1999,1998,1997,1996,1995,1994,1993
Download
Estadísticas Globales de la Biblioteca →Burundi →

Net current transfers from abroad (current LCU)

Estas estadísticas en otros países:
AfghanistanAlbaniaAlgeriaAngolaAntigua and BarbudaArgentinaArmeniaAustraliaAustriaAzerbaijanBahamas, TheBangladeshBarbadosBelarusBelgiumBelizeBeninBermudaBhutanBoliviaBosnia and HerzegovinaBotswanaBrazilBrunei DarussalamBulgariaBurkina FasoBurundiCabo VerdeCambodiaCameroonCanadaCentral African RepublicChadChileChinaColombiaComorosCongo, Dem. Rep.Congo, Rep.Costa RicaCote d'IvoireCroatiaCzech RepublicDenmarkDjiboutiDominicaDominican RepublicEcuadorEgypt, Arab Rep.El SalvadorEquatorial GuineaEritreaEstoniaEthiopiaFaroe IslandsFijiFinlandFranceFrench PolynesiaGabonGambia, TheGeorgiaGermanyGhanaGreeceGrenadaGuatemalaGuineaGuinea-BissauGuyanaHaitiHondurasHong Kong SAR, ChinaHungaryIcelandIndiaIndonesiaIran, Islamic Rep.IraqIrelandIsraelItalyJamaicaJapanJordanKazakhstanKenyaKiribatiKorea, Rep.KosovoKyrgyz RepublicLao PDRLatviaLebanonLesothoLiberiaLibyaLithuaniaMacedonia, FYRMadagascarMalawiMalaysiaMaldivesMaliMauritaniaMauritiusMexicoMoldovaMongoliaMontenegroMoroccoMozambiqueMyanmarNamibiaNepalNetherlandsNew ZealandNicaraguaNigerNigeriaNorwayPakistanPalauPanamaPapua New GuineaParaguayPeruPhilippinesPolandPortugalRomaniaRussian FederationRwandaSamoaSao Tome and PrincipeSenegalSerbiaSeychellesSierra LeoneSingaporeSlovak RepublicSloveniaSolomon IslandsSouth AfricaSouth SudanSpainSri LankaSt. Kitts and NevisSt. LuciaSt. Vincent and the GrenadinesSudanSurinameSwazilandSwedenSwitzerlandSyrian Arab RepublicTajikistanTanzaniaThailandTimor-LesteTogoTongaTrinidad and TobagoTunisiaTurkeyTurkmenistanUgandaUkraineUnited KingdomUnited StatesUruguayUzbekistanVanuatuVenezuela, RBVietnamWest Bank and GazaYemen, Rep.ZambiaZimbabwe
línea de tiempo (timeline):
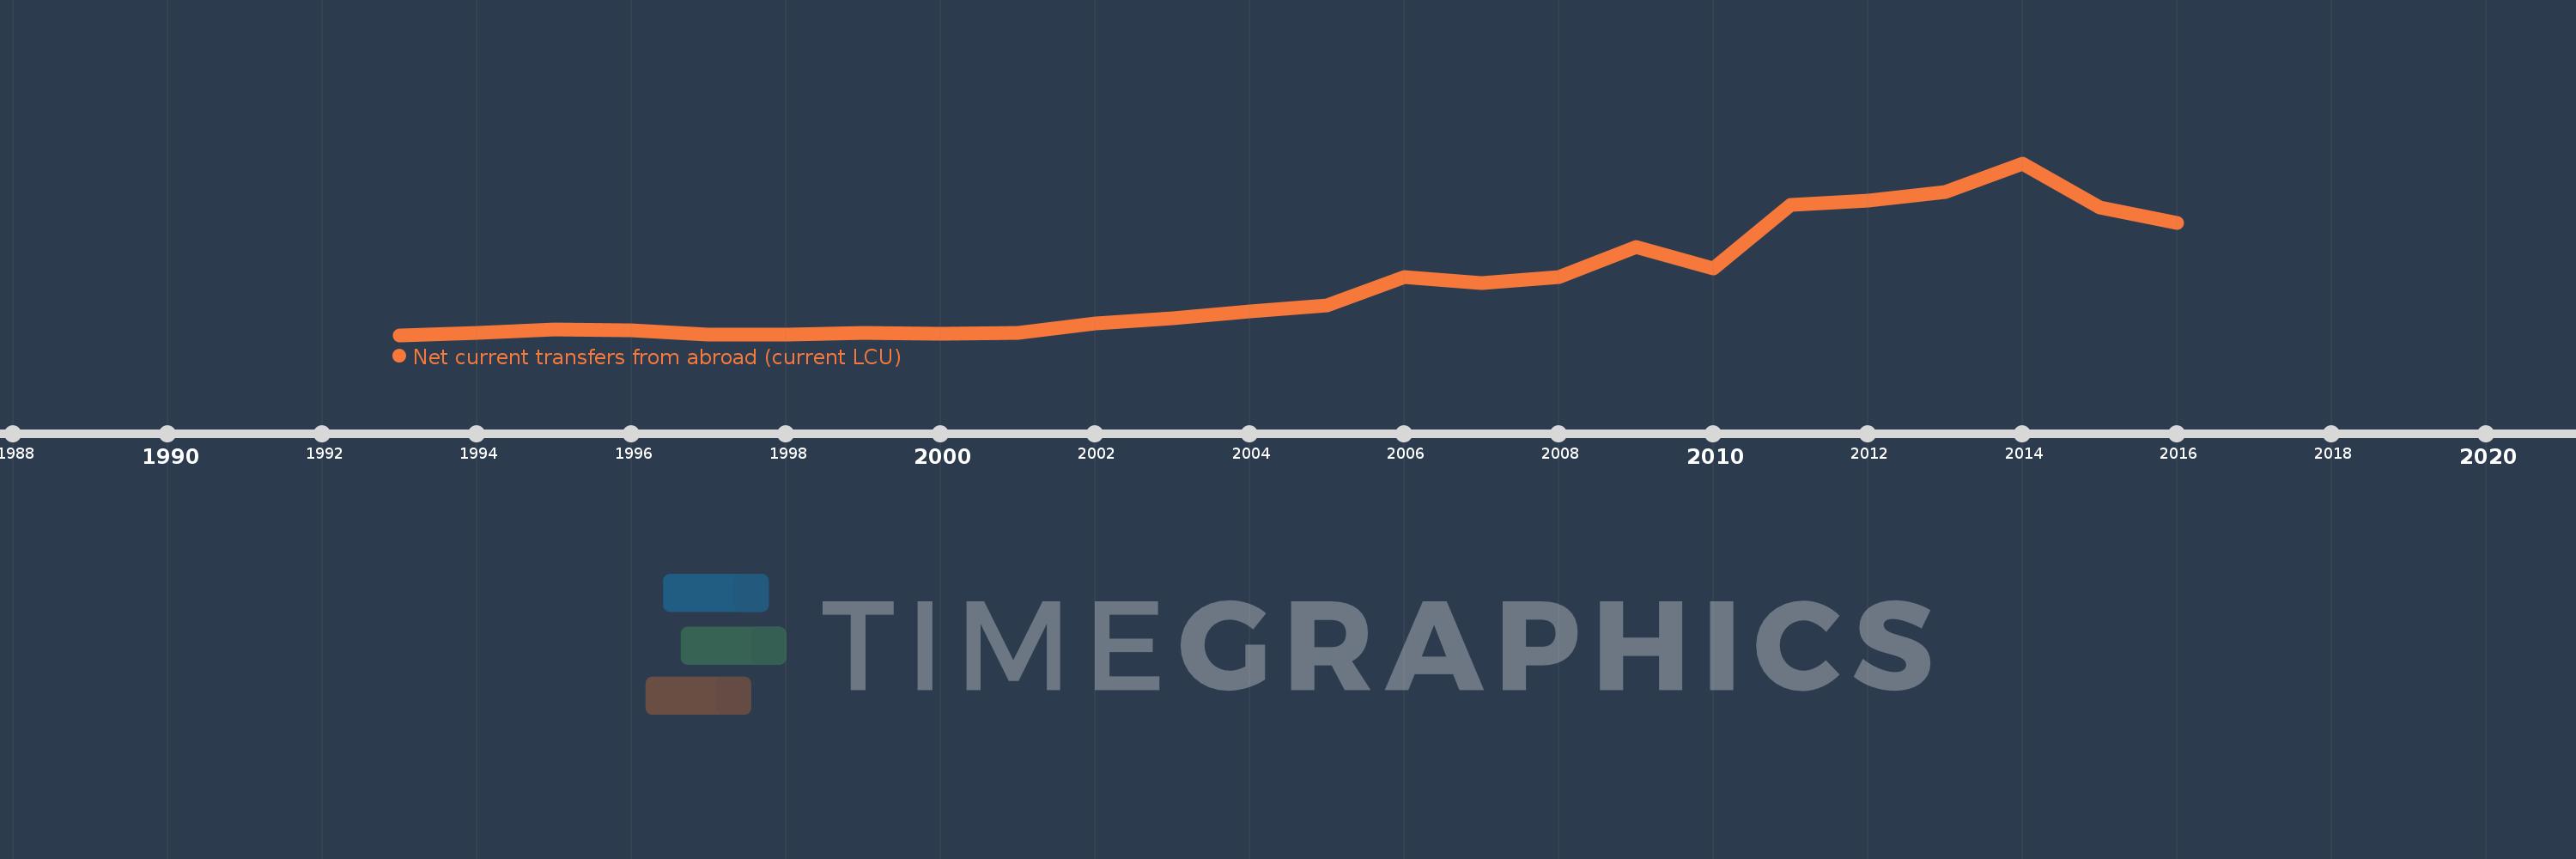
En esta escala de tiempo se presenta un gráfico de 1993 y 2016 de Burundi. Los datos de 1992 están ausentes. El número de observaciones reales por fecha: 24.
Fuente (nombre):
Indicadores del desarrollo mundial
Fuente (organización):
World Bank national accounts data, and OECD National Accounts data files.
Categorías:
Economy & Growth
Se ha actualizado:
23 abr 2017 año
Los indicadores de los cambios de valor en los últimos años
En promedio:
234.035 bn
Mínimo:
13.456 bn
1 ene 1993 año
Máximo:
745.858 bn
1 ene 2014 año
A la fecha de observación
Valor
Cambio absoluto
El cambio con respecto al valor anterior
1 ene 1993 año
13.456 bn
+13.456 bn
0.0%
1 ene 1994 año
23.258 bn
+9.802 bn
72.84%
1 ene 1995 año
37.141 bn
+13.883 bn
59.69%
1 ene 1996 año
31.894 bn
-5.247 bn
-14.13%
1 ene 1997 año
14.32 bn
-17.574 bn
-55.1%
1 ene 1998 año
16.807 bn
+2.487 bn
17.37%
1 ene 1999 año
21.403 bn
+4.596 bn
27.35%
1 ene 2000 año
17.47 bn
-3.933 bn
-18.38%
1 ene 2001 año
22.917 bn
+5.447 bn
31.18%
1 ene 2002 año
61.904 bn
+38.987 bn
170.12%
1 ene 2003 año
86.524 bn
+24.619 bn
39.77%
1 ene 2004 año
113.907 bn
+27.383 bn
31.65%
1 ene 2005 año
138.607 bn
+24.7 bn
21.68%
1 ene 2006 año
260.553 bn
+121.945 bn
87.98%
1 ene 2007 año
235.466 bn
-25.087 bn
-9.63%
1 ene 2008 año
259.757 bn
+24.291 bn
10.32%
1 ene 2009 año
390.448 bn
+130.691 bn
50.31%
1 ene 2010 año
296.596 bn
-93.852 bn
-24.04%
1 ene 2011 año
567.867 bn
+271.271 bn
91.46%
1 ene 2012 año
585.39 bn
+17.523 bn
3.09%
1 ene 2013 año
624.619 bn
+39.228 bn
6.7%
1 ene 2014 año
745.858 bn
+121.239 bn
19.41%
1 ene 2015 año
558.65 bn
-187.207 bn
-25.1%
1 ene 2016 año
492.026 bn
-66.624 bn
-11.93%
Ranking de los países por los datos estadísticos actuales

Comentarios:

Enviar
PremiumAbout & FeedbackAcuerdoPrivacidad
logo
© 2022 Selected Technologies LLC – Morgan Hill, California