29
/es/
es
AIzaSyAYiBZKx7MnpbEhh9jyipgxe19OcubqV5w
April 1, 2024
166509
Kazakhstan
KAZ
true
2
1
Net current transfers from abroad (current LCU)
2016,2015,2014,2013,2012,2011,2010,2009,2008,2007,2006,2005,2004,2003,2002,2001,2000,1999,1998,1997,1996,1995,1994
Download
Estadísticas Globales de la Biblioteca →Kazakhstan →

Net current transfers from abroad (current LCU)

Estas estadísticas en otros países:
AfghanistanAlbaniaAlgeriaAngolaAntigua and BarbudaArgentinaArmeniaAustraliaAustriaAzerbaijanBahamas, TheBangladeshBarbadosBelarusBelgiumBelizeBeninBermudaBhutanBoliviaBosnia and HerzegovinaBotswanaBrazilBrunei DarussalamBulgariaBurkina FasoBurundiCabo VerdeCambodiaCameroonCanadaCentral African RepublicChadChileChinaColombiaComorosCongo, Dem. Rep.Congo, Rep.Costa RicaCote d'IvoireCroatiaCzech RepublicDenmarkDjiboutiDominicaDominican RepublicEcuadorEgypt, Arab Rep.El SalvadorEquatorial GuineaEritreaEstoniaEthiopiaFaroe IslandsFijiFinlandFranceFrench PolynesiaGabonGambia, TheGeorgiaGermanyGhanaGreeceGrenadaGuatemalaGuineaGuinea-BissauGuyanaHaitiHondurasHong Kong SAR, ChinaHungaryIcelandIndiaIndonesiaIran, Islamic Rep.IraqIrelandIsraelItalyJamaicaJapanJordanKazakhstanKenyaKiribatiKorea, Rep.KosovoKyrgyz RepublicLao PDRLatviaLebanonLesothoLiberiaLibyaLithuaniaMacedonia, FYRMadagascarMalawiMalaysiaMaldivesMaliMauritaniaMauritiusMexicoMoldovaMongoliaMontenegroMoroccoMozambiqueMyanmarNamibiaNepalNetherlandsNew ZealandNicaraguaNigerNigeriaNorwayPakistanPalauPanamaPapua New GuineaParaguayPeruPhilippinesPolandPortugalRomaniaRussian FederationRwandaSamoaSao Tome and PrincipeSenegalSerbiaSeychellesSierra LeoneSingaporeSlovak RepublicSloveniaSolomon IslandsSouth AfricaSouth SudanSpainSri LankaSt. Kitts and NevisSt. LuciaSt. Vincent and the GrenadinesSudanSurinameSwazilandSwedenSwitzerlandSyrian Arab RepublicTajikistanTanzaniaThailandTimor-LesteTogoTongaTrinidad and TobagoTunisiaTurkeyTurkmenistanUgandaUkraineUnited KingdomUnited StatesUruguayUzbekistanVanuatuVenezuela, RBVietnamWest Bank and GazaYemen, Rep.ZambiaZimbabwe
línea de tiempo (timeline):
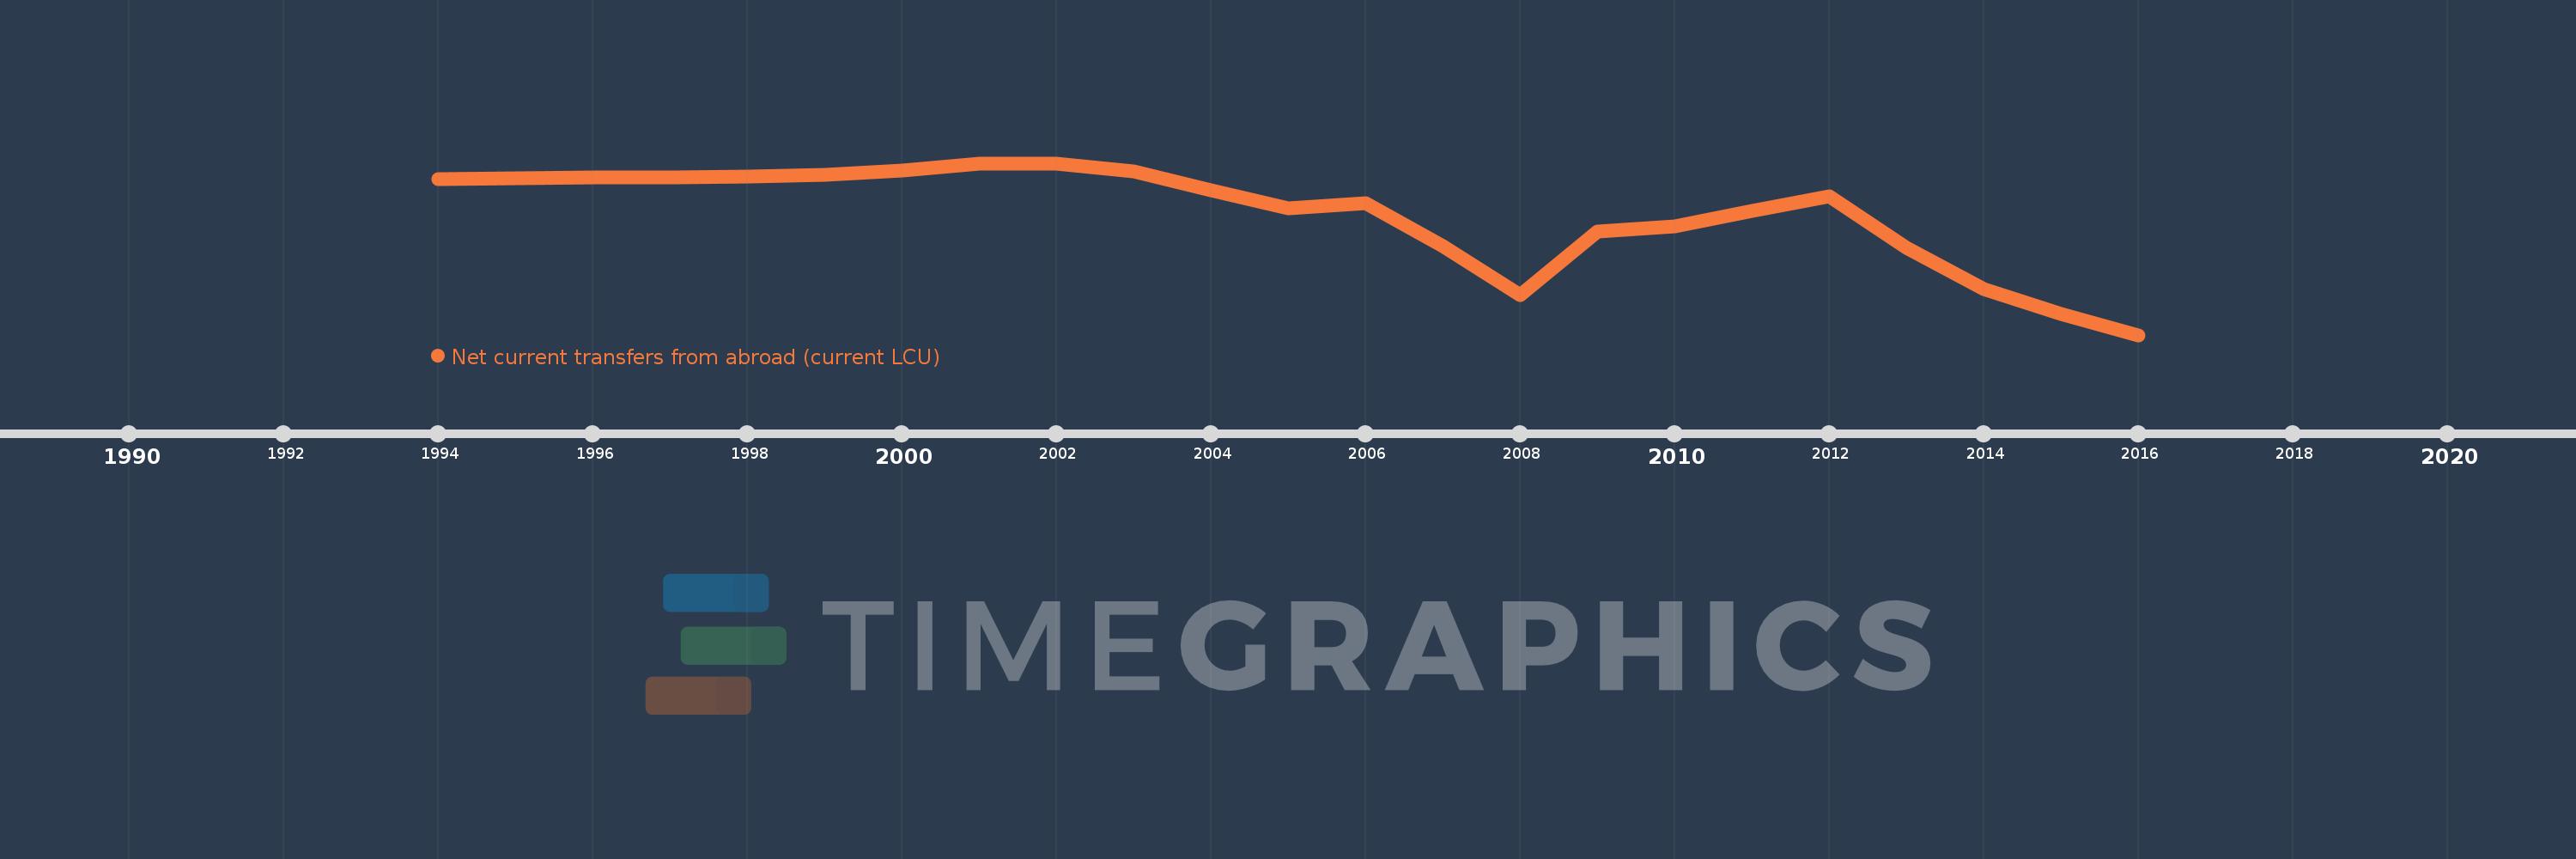
En esta escala de tiempo se presenta un gráfico de 1994 y 2016 de Kazakhstan. Los datos de 1993 están ausentes. El número de observaciones reales por fecha: 23.
Fuente (nombre):
Indicadores del desarrollo mundial
Fuente (organización):
World Bank national accounts data, and OECD National Accounts data files.
Categorías:
Economy & Growth
Se ha actualizado:
23 abr 2017 año
Los indicadores de los cambios de valor en los últimos años
En promedio:
-79.39 bn
Mínimo:
-351.699 bn
1 ene 2016 año
Máximo:
35.392 bn
1 ene 2001 año
A la fecha de observación
Valor
Cambio absoluto
El cambio con respecto al valor anterior
1 ene 1994 año
162.519 millones
+162.519 millones
0.0%
1 ene 1995 año
1.933 bn
+1.77 bn
1.09 mil%
1 ene 1996 año
2.937 bn
+1.004 bn
51.94%
1 ene 1997 año
3.931 bn
+993.619 millones
33.83%
1 ene 1998 año
5.628 bn
+1.697 bn
43.18%
1 ene 1999 año
9.576 bn
+3.949 bn
70.17%
1 ene 2000 año
18.717 bn
+9.141 bn
95.45%
1 ene 2001 año
35.392 bn
+16.675 bn
89.09%
1 ene 2002 año
34.991 bn
-401.843 millones
-1.14%
1 ene 2003 año
17.434 bn
-17.557 bn
-50.18%
1 ene 2004 año
-24.631 bn
-42.065 bn
-241.28%
1 ene 2005 año
-66.406 bn
-41.775 bn
169.6%
1 ene 2006 año
-55.266 bn
+11.14 bn
-16.78%
1 ene 2007 año
-151.931 bn
-96.665 bn
174.91%
1 ene 2008 año
-261.35 bn
-109.419 bn
72.02%
1 ene 2009 año
-118.381 bn
+142.97 bn
-54.7%
1 ene 2010 año
-107.661 bn
+10.72 bn
-9.06%
1 ene 2011 año
-72.012 bn
+35.649 bn
-33.11%
1 ene 2012 año
-39.072 bn
+32.94 bn
-45.74%
1 ene 2013 año
-155.598 bn
-116.526 bn
298.23%
1 ene 2014 año
-247.762 bn
-92.163 bn
59.23%
1 ene 2015 año
-304.909 bn
-57.148 bn
23.07%
1 ene 2016 año
-351.699 bn
-46.789 bn
15.35%
Ranking de los países por los datos estadísticos actuales

Comentarios:

Enviar
PremiumAbout & FeedbackAcuerdoPrivacidad
logo
© 2022 Selected Technologies LLC – Morgan Hill, California