29
/es/
es
AIzaSyAYiBZKx7MnpbEhh9jyipgxe19OcubqV5w
April 1, 2024
225180
Poland
POL
true
2
1
Net current transfers from abroad (current LCU)
2015,2014,2013,2012,2011,2010,2009,2008,2007,2006,2005,2004,2003,2002,2001,2000,1999,1998,1997,1996,1995,1994,1993,1992
Download
Estadísticas Globales de la Biblioteca →Poland →

Net current transfers from abroad (current LCU)

Estas estadísticas en otros países:
AfghanistanAlbaniaAlgeriaAngolaAntigua and BarbudaArgentinaArmeniaAustraliaAustriaAzerbaijanBahamas, TheBangladeshBarbadosBelarusBelgiumBelizeBeninBermudaBhutanBoliviaBosnia and HerzegovinaBotswanaBrazilBrunei DarussalamBulgariaBurkina FasoBurundiCabo VerdeCambodiaCameroonCanadaCentral African RepublicChadChileChinaColombiaComorosCongo, Dem. Rep.Congo, Rep.Costa RicaCote d'IvoireCroatiaCzech RepublicDenmarkDjiboutiDominicaDominican RepublicEcuadorEgypt, Arab Rep.El SalvadorEquatorial GuineaEritreaEstoniaEthiopiaFaroe IslandsFijiFinlandFranceFrench PolynesiaGabonGambia, TheGeorgiaGermanyGhanaGreeceGrenadaGuatemalaGuineaGuinea-BissauGuyanaHaitiHondurasHong Kong SAR, ChinaHungaryIcelandIndiaIndonesiaIran, Islamic Rep.IraqIrelandIsraelItalyJamaicaJapanJordanKazakhstanKenyaKiribatiKorea, Rep.KosovoKyrgyz RepublicLao PDRLatviaLebanonLesothoLiberiaLibyaLithuaniaMacedonia, FYRMadagascarMalawiMalaysiaMaldivesMaliMauritaniaMauritiusMexicoMoldovaMongoliaMontenegroMoroccoMozambiqueMyanmarNamibiaNepalNetherlandsNew ZealandNicaraguaNigerNigeriaNorwayPakistanPalauPanamaPapua New GuineaParaguayPeruPhilippinesPolandPortugalRomaniaRussian FederationRwandaSamoaSao Tome and PrincipeSenegalSerbiaSeychellesSierra LeoneSingaporeSlovak RepublicSloveniaSolomon IslandsSouth AfricaSouth SudanSpainSri LankaSt. Kitts and NevisSt. LuciaSt. Vincent and the GrenadinesSudanSurinameSwazilandSwedenSwitzerlandSyrian Arab RepublicTajikistanTanzaniaThailandTimor-LesteTogoTongaTrinidad and TobagoTunisiaTurkeyTurkmenistanUgandaUkraineUnited KingdomUnited StatesUruguayUzbekistanVanuatuVenezuela, RBVietnamWest Bank and GazaYemen, Rep.ZambiaZimbabwe
línea de tiempo (timeline):
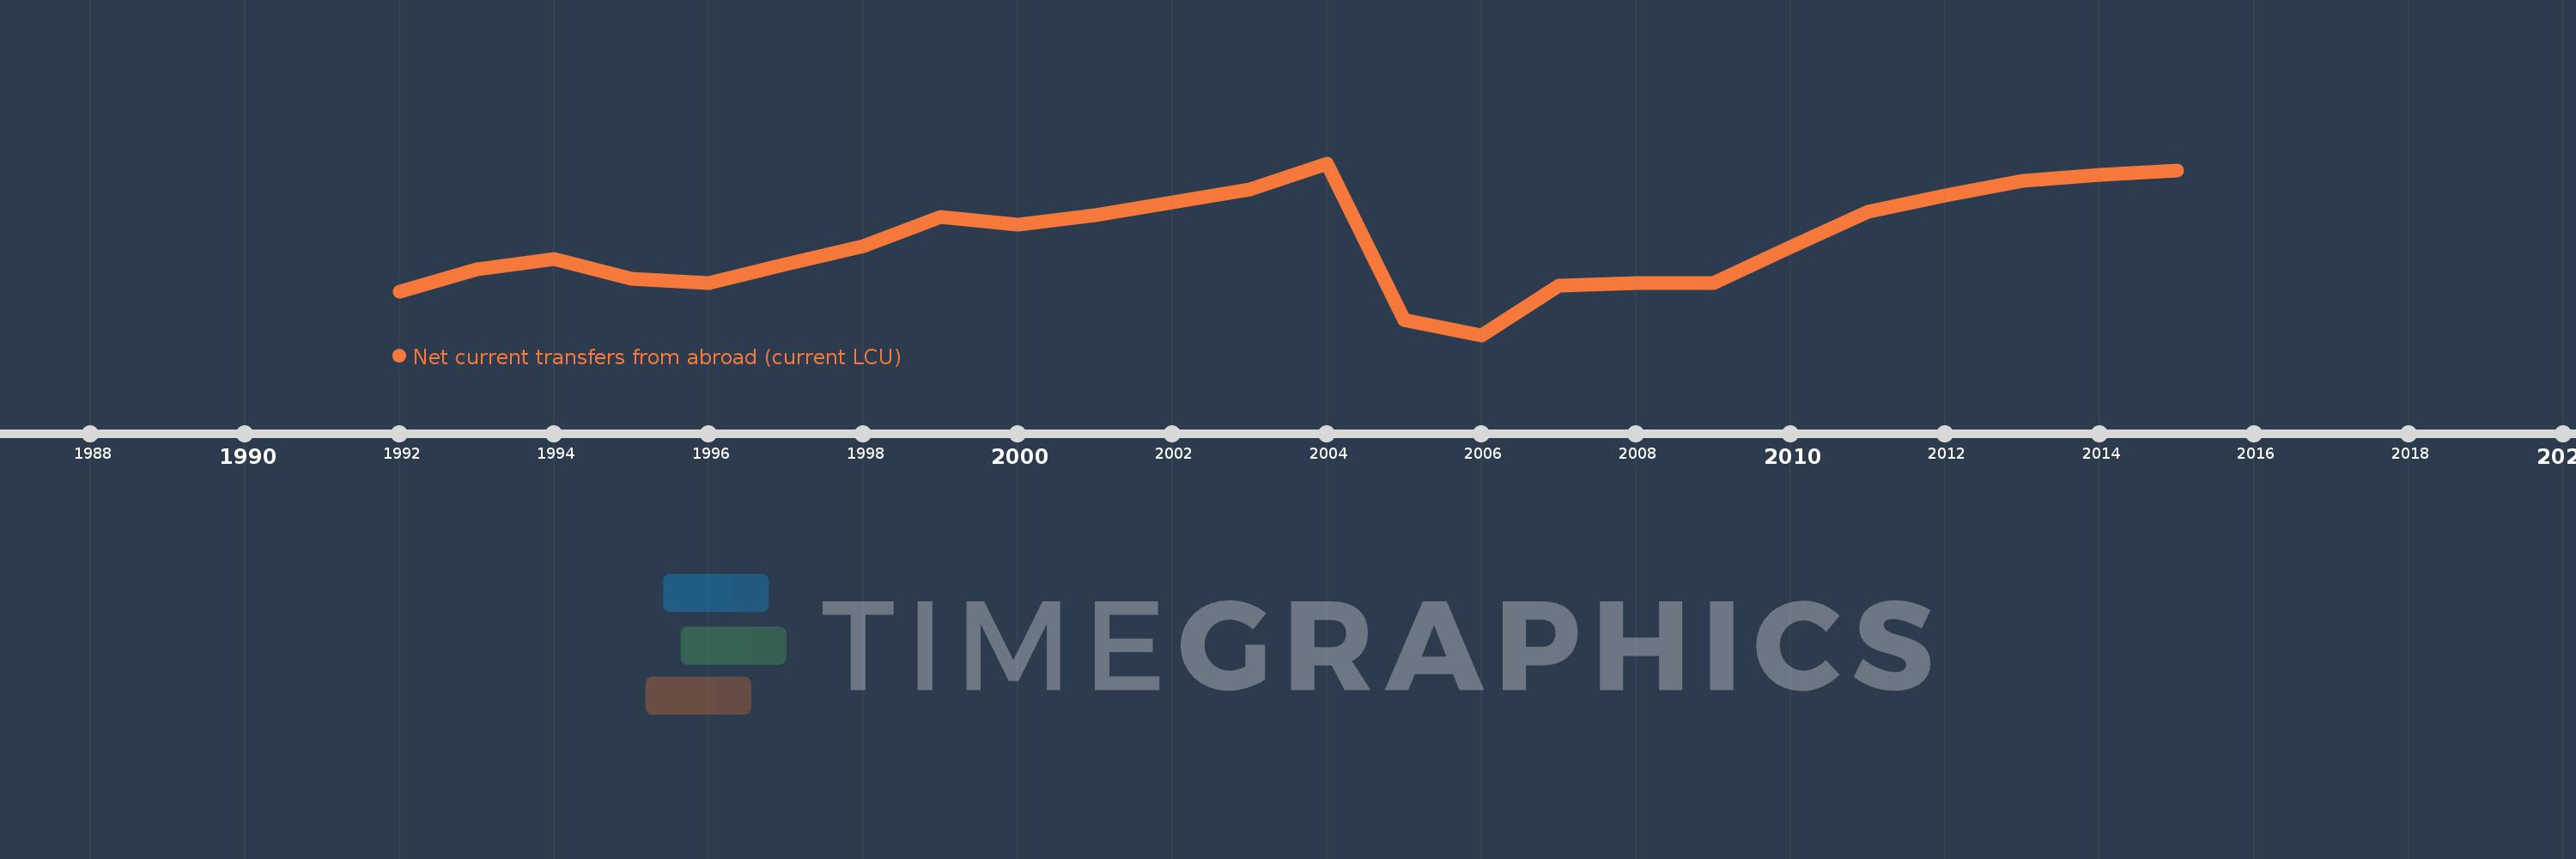
En esta escala de tiempo se presenta un gráfico de 1992 y 2015 de Poland. Los datos de 1991 están ausentes. El número de observaciones reales por fecha: 24.
Fuente (nombre):
Indicadores del desarrollo mundial
Fuente (organización):
World Bank national accounts data, and OECD National Accounts data files.
Categorías:
Economy & Growth
Se ha actualizado:
23 abr 2017 año
Los indicadores de los cambios de valor en los últimos años
En promedio:
7.251 bn
Mínimo:
-3.802 bn
1 ene 2006 año
Máximo:
16.466 bn
1 ene 2004 año
A la fecha de observación
Valor
Cambio absoluto
El cambio con respecto al valor anterior
1 ene 1992 año
1.289 bn
+1.289 bn
0.0%
1 ene 1993 año
3.994 bn
+2.705 bn
209.87%
1 ene 1994 año
5.154 bn
+1.16 bn
29.05%
1 ene 1995 año
2.846 bn
-2.308 bn
-44.78%
1 ene 1996 año
2.323 bn
-522.889 millones
-18.37%
1 ene 1997 año
4.568 bn
+2.245 bn
96.64%
1 ene 1998 año
6.676 bn
+2.108 bn
46.15%
1 ene 1999 año
10.121 bn
+3.445 bn
51.6%
1 ene 2000 año
9.214 bn
-907.0 millones
-8.96%
1 ene 2001 año
10.345 bn
+1.131 bn
12.27%
1 ene 2002 año
11.827 bn
+1.482 bn
14.33%
1 ene 2003 año
13.381 bn
+1.554 bn
13.14%
1 ene 2004 año
16.466 bn
+3.085 bn
23.06%
1 ene 2005 año
-2.065 bn
-18.531 bn
-112.54%
1 ene 2006 año
-3.802 bn
-1.737 bn
84.12%
1 ene 2007 año
2.05 bn
+5.852 bn
-153.92%
1 ene 2008 año
2.321 bn
+271.0 millones
13.22%
1 ene 2009 año
2.289 bn
-32.0 millones
-1.38%
1 ene 2010 año
6.549 bn
+4.26 bn
186.11%
1 ene 2011 año
10.714 bn
+4.165 bn
63.6%
1 ene 2012 año
12.656 bn
+1.942 bn
18.13%
1 ene 2013 año
14.384 bn
+1.728 bn
13.65%
1 ene 2014 año
15.09 bn
+706.0 millones
4.91%
1 ene 2015 año
15.627 bn
+537.0 millones
3.56%
Ranking de los países por los datos estadísticos actuales

Comentarios:

Enviar
PremiumAbout & FeedbackAcuerdoPrivacidad
logo
© 2022 Selected Technologies LLC – Morgan Hill, California