33
/es/
AIzaSyAYiBZKx7MnpbEhh9jyipgxe19OcubqV5w
August 1, 2025
152857
Hungary
HUN
true
2
1
Net current transfers from abroad (current LCU)
2015,2014,2013,2012,2011,2010,2009,2008,2007,2006,2005,2004,2003,2002,2001,2000,1999,1998,1997,1996
Download
Estadísticas Globales de la Biblioteca →Hungary →

Net current transfers from abroad (current LCU)

Estas estadísticas en otros países:

AfghanistanAlbaniaAlgeriaAngolaAntigua and BarbudaArgentinaArmeniaAustraliaAustriaAzerbaijanBahamas, TheBangladeshBarbadosBelarusBelgiumBelizeBeninBermudaBhutanBoliviaBosnia and HerzegovinaBotswanaBrazilBrunei DarussalamBulgariaBurkina FasoBurundiCabo VerdeCambodiaCameroonCanadaCentral African RepublicChadChileChinaColombiaComorosCongo, Dem. Rep.Congo, Rep.Costa RicaCote d'IvoireCroatiaCzech RepublicDenmarkDjiboutiDominicaDominican RepublicEcuadorEgypt, Arab Rep.El SalvadorEquatorial GuineaEritreaEstoniaEthiopiaFaroe IslandsFijiFinlandFranceFrench PolynesiaGabonGambia, TheGeorgiaGermanyGhanaGreeceGrenadaGuatemalaGuineaGuinea-BissauGuyanaHaitiHondurasHong Kong SAR, ChinaHungaryIcelandIndiaIndonesiaIran, Islamic Rep.IraqIrelandIsraelItalyJamaicaJapanJordanKazakhstanKenyaKiribatiKorea, Rep.KosovoKyrgyz RepublicLao PDRLatviaLebanonLesothoLiberiaLibyaLithuaniaMacedonia, FYRMadagascarMalawiMalaysiaMaldivesMaliMauritaniaMauritiusMexicoMoldovaMongoliaMontenegroMoroccoMozambiqueMyanmarNamibiaNepalNetherlandsNew ZealandNicaraguaNigerNigeriaNorwayPakistanPalauPanamaPapua New GuineaParaguayPeruPhilippinesPolandPortugalRomaniaRussian FederationRwandaSamoaSao Tome and PrincipeSenegalSerbiaSeychellesSierra LeoneSingaporeSlovak RepublicSloveniaSolomon IslandsSouth AfricaSouth SudanSpainSri LankaSt. Kitts and NevisSt. LuciaSt. Vincent and the GrenadinesSudanSurinameSwazilandSwedenSwitzerlandSyrian Arab RepublicTajikistanTanzaniaThailandTimor-LesteTogoTongaTrinidad and TobagoTunisiaTurkeyTurkmenistanUgandaUkraineUnited KingdomUnited StatesUruguayUzbekistanVanuatuVenezuela, RBVietnamWest Bank and GazaYemen, Rep.ZambiaZimbabwe

línea de tiempo (timeline):

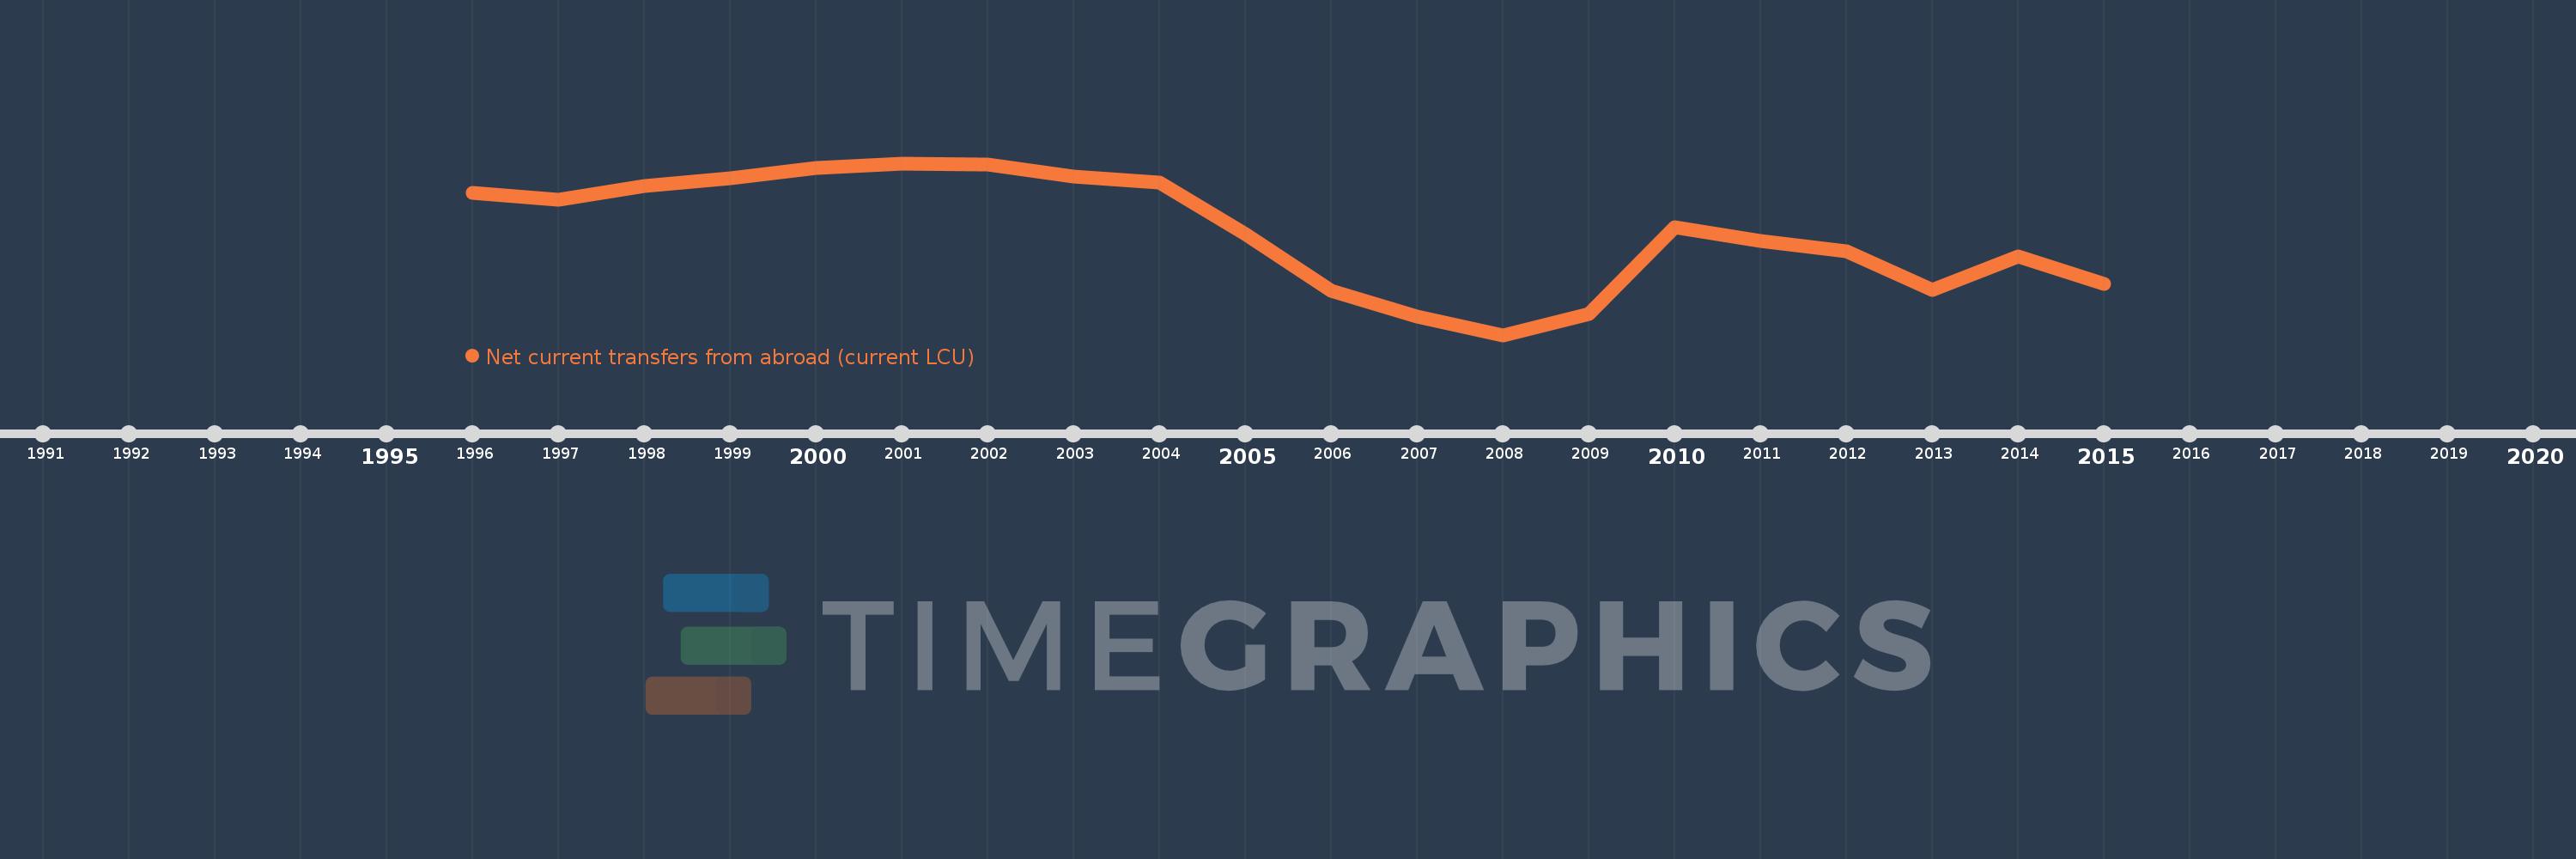
En esta escala de tiempo se presenta un gráfico de 1996 y 2015 de Hungary. Los datos de 1995 están ausentes. El número de observaciones reales por fecha: 20.

Fuente (nombre):

Indicadores del desarrollo mundial

Fuente (organización):

World Bank national accounts data, and OECD National Accounts data files.

Categorías:

Economy & Growth

Se ha actualizado:

23 abr 2017 año

Los indicadores de los cambios de valor en los últimos años

En promedio:
-94.442 bn
Mínimo:
-344.836 bn
1 ene 2008 año
Máximo:
74.734 bn
1 ene 2001 año
A la fecha de observación
Valor
Cambio absoluto
El cambio con respecto al valor anterior
1 ene 1996 año
3.043 bn
+3.043 bn
0.0%
1 ene 1997 año
-14.419 bn
-17.462 bn
-573.84%
1 ene 1998 año
19.183 bn
+33.602 bn
-233.04%
1 ene 1999 año
38.37 bn
+19.187 bn
100.02%
1 ene 2000 año
63.663 bn
+25.293 bn
65.92%
1 ene 2001 año
74.734 bn
+11.071 bn
17.39%
1 ene 2002 año
72.211 bn
-2.523 bn
-3.38%
1 ene 2003 año
43.182 bn
-29.029 bn
-40.2%
1 ene 2004 año
28.26 bn
-14.922 bn
-34.56%
1 ene 2005 año
-98.431 bn
-126.691 bn
-448.31%
1 ene 2006 año
-237.119 bn
-138.688 bn
140.9%
1 ene 2007 año
-300.645 bn
-63.526 bn
26.79%
1 ene 2008 año
-344.836 bn
-44.191 bn
14.7%
1 ene 2009 año
-294.105 bn
+50.731 bn
-14.71%
1 ene 2010 año
-82.165 bn
+211.94 bn
-72.06%
1 ene 2011 año
-114.344 bn
-32.179 bn
39.16%
1 ene 2012 año
-139.376 bn
-25.032 bn
21.89%
1 ene 2013 año
-234.489 bn
-95.113 bn
68.24%
1 ene 2014 año
-152.523 bn
+81.966 bn
-34.96%
1 ene 2015 año
-219.029 bn
-66.506 bn
43.6%

Ranking de los países por los datos estadísticos actuales