33
/es/
AIzaSyAYiBZKx7MnpbEhh9jyipgxe19OcubqV5w
August 1, 2025
82235
Belgium
BEL
true
2
1
Services, etc., value added (current LCU)
2016,2015,2014,2013,2012,2011,2010,2009,2008,2007,2006,2005,2004,2003,2002,2001,2000,1999,1998,1997,1996
Download
Estadísticas Globales de la Biblioteca →Belgium →

Services, etc., value added (current LCU)

Estas estadísticas en otros países:

AfghanistanAlbaniaAlgeriaAndorraAngolaAntigua and BarbudaArgentinaArmeniaArubaAustraliaAustriaAzerbaijanBahamas, TheBahrainBangladeshBarbadosBelarusBelgiumBelizeBeninBermudaBhutanBoliviaBosnia and HerzegovinaBotswanaBrazilBrunei DarussalamBulgariaBurkina FasoBurundiCabo VerdeCambodiaCameroonCanadaCentral African RepublicChadChileChinaColombiaComorosCongo, Dem. Rep.Congo, Rep.Costa RicaCote d'IvoireCroatiaCubaCyprusCzech RepublicDenmarkDjiboutiDominicaDominican RepublicEcuadorEgypt, Arab Rep.El SalvadorEquatorial GuineaEritreaEstoniaEthiopiaFaroe IslandsFijiFinlandFranceGabonGambia, TheGeorgiaGermanyGhanaGreeceGrenadaGuatemalaGuineaGuinea-BissauGuyanaHondurasHong Kong SAR, ChinaHungaryIcelandIndiaIndonesiaIran, Islamic Rep.IraqIrelandItalyJamaicaJapanJordanKazakhstanKenyaKiribatiKorea, Rep.KosovoKuwaitKyrgyz RepublicLao PDRLatviaLebanonLesothoLiberiaLibyaLithuaniaLuxembourgMacao SAR, ChinaMacedonia, FYRMadagascarMalawiMalaysiaMaldivesMaliMaltaMarshall IslandsMauritaniaMauritiusMexicoMicronesia, Fed. Sts.MoldovaMongoliaMontenegroMoroccoMozambiqueMyanmarNamibiaNepalNetherlandsNew CaledoniaNew ZealandNicaraguaNigerNigeriaNorwayOmanPakistanPalauPanamaPapua New GuineaParaguayPeruPhilippinesPolandPortugalPuerto RicoQatarRomaniaRussian FederationRwandaSamoaSao Tome and PrincipeSaudi ArabiaSenegalSerbiaSeychellesSierra LeoneSingaporeSlovak RepublicSloveniaSolomon IslandsSomaliaSouth AfricaSpainSri LankaSt. Kitts and NevisSt. LuciaSt. Vincent and the GrenadinesSudanSurinameSwazilandSwedenSwitzerlandSyrian Arab RepublicTajikistanTanzaniaThailandTimor-LesteTogoTongaTrinidad and TobagoTunisiaTurkeyTurkmenistanTuvaluUgandaUkraineUnited Arab EmiratesUnited KingdomUnited StatesUruguayUzbekistanVanuatuVenezuela, RBVietnamWest Bank and GazaYemen, Rep.ZambiaZimbabwe

línea de tiempo (timeline):

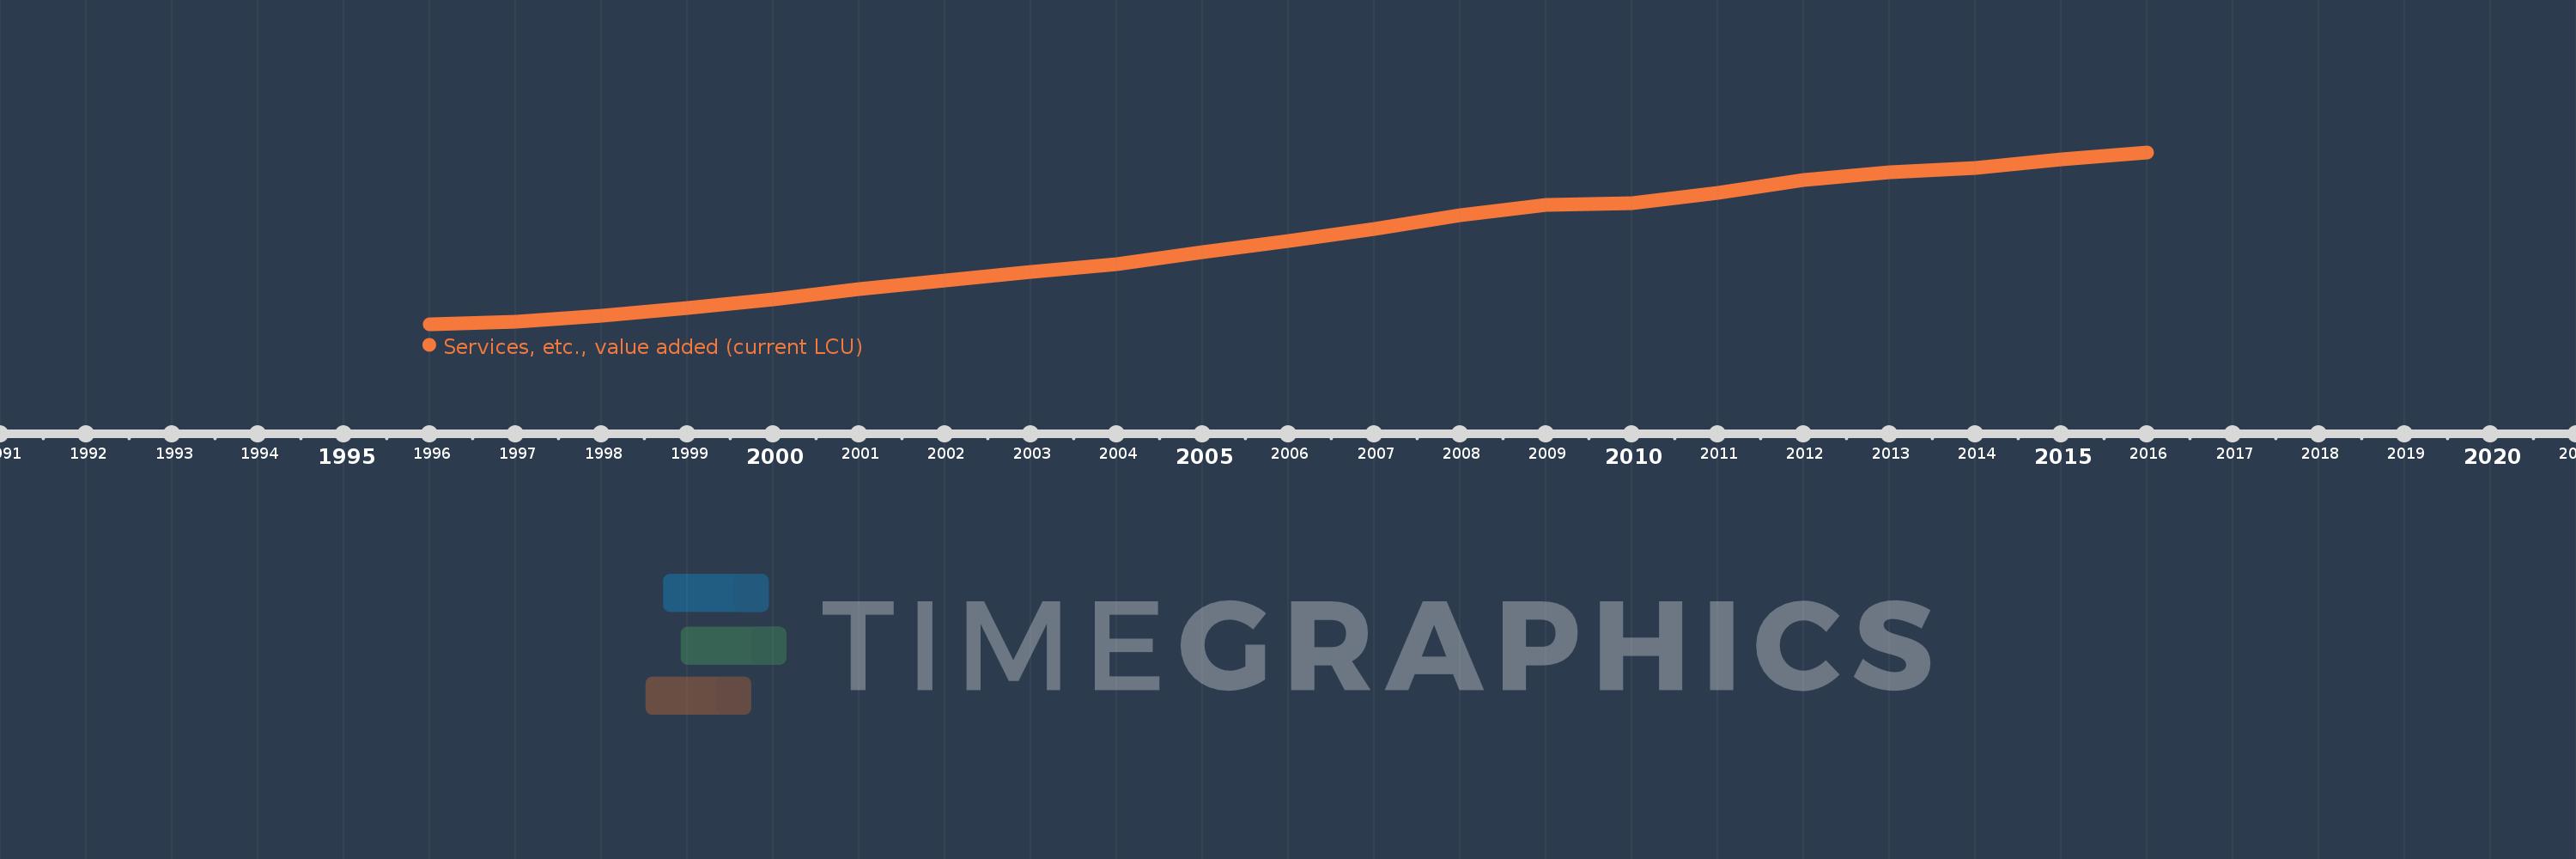
En esta escala de tiempo se presenta un gráfico de 1996 y 2016 de Belgium. Los datos de 1995 están ausentes. El número de observaciones reales por fecha: 21.

Fuente (nombre):

Indicadores del desarrollo mundial

Fuente (organización):

World Bank national accounts data, and OECD National Accounts data files.

Categorías:

Economy & Growth

Se ha actualizado:

23 abr 2017 año

Los indicadores de los cambios de valor en los últimos años

En promedio:
206.402 bn
Mínimo:
132.955 bn
1 ene 1996 año
Máximo:
283.133 bn
1 ene 2016 año
A la fecha de observación
Valor
Cambio absoluto
El cambio con respecto al valor anterior
1 ene 1996 año
132.955 bn
+132.955 bn
0.0%
1 ene 1997 año
135.362 bn
+2.407 bn
1.81%
1 ene 1998 año
140.435 bn
+5.073 bn
3.75%
1 ene 1999 año
147.133 bn
+6.698 bn
4.77%
1 ene 2000 año
154.972 bn
+7.839 bn
5.33%
1 ene 2001 año
163.377 bn
+8.405 bn
5.42%
1 ene 2002 año
171.183 bn
+7.806 bn
4.78%
1 ene 2003 año
178.504 bn
+7.321 bn
4.28%
1 ene 2004 año
185.623 bn
+7.12 bn
3.99%
1 ene 2005 año
195.827 bn
+10.204 bn
5.5%
1 ene 2006 año
205.982 bn
+10.155 bn
5.19%
1 ene 2007 año
216.065 bn
+10.084 bn
4.9%
1 ene 2008 año
228.016 bn
+11.951 bn
5.53%
1 ene 2009 año
237.434 bn
+9.418 bn
4.13%
1 ene 2010 año
238.801 bn
+1.367 bn
0.58%
1 ene 2011 año
248.072 bn
+9.271 bn
3.88%
1 ene 2012 año
259.052 bn
+10.981 bn
4.43%
1 ene 2013 año
265.82 bn
+6.767 bn
2.61%
1 ene 2014 año
269.612 bn
+3.793 bn
1.43%
1 ene 2015 año
277.089 bn
+7.477 bn
2.77%
1 ene 2016 año
283.133 bn
+6.043 bn
2.18%

Ranking de los países por los datos estadísticos actuales