33
/es/
AIzaSyAYiBZKx7MnpbEhh9jyipgxe19OcubqV5w
August 1, 2025
182559
Luxembourg
LUX
true
2
1
Services, etc., value added (current LCU)
2016,2015,2014,2013,2012,2011,2010,2009,2008,2007,2006,2005,2004,2003,2002,2001,2000,1999,1998,1997,1996
Download
Estadísticas Globales de la Biblioteca →Luxembourg →

Services, etc., value added (current LCU)

Estas estadísticas en otros países:

AfghanistanAlbaniaAlgeriaAndorraAngolaAntigua and BarbudaArgentinaArmeniaArubaAustraliaAustriaAzerbaijanBahamas, TheBahrainBangladeshBarbadosBelarusBelgiumBelizeBeninBermudaBhutanBoliviaBosnia and HerzegovinaBotswanaBrazilBrunei DarussalamBulgariaBurkina FasoBurundiCabo VerdeCambodiaCameroonCanadaCentral African RepublicChadChileChinaColombiaComorosCongo, Dem. Rep.Congo, Rep.Costa RicaCote d'IvoireCroatiaCubaCyprusCzech RepublicDenmarkDjiboutiDominicaDominican RepublicEcuadorEgypt, Arab Rep.El SalvadorEquatorial GuineaEritreaEstoniaEthiopiaFaroe IslandsFijiFinlandFranceGabonGambia, TheGeorgiaGermanyGhanaGreeceGrenadaGuatemalaGuineaGuinea-BissauGuyanaHondurasHong Kong SAR, ChinaHungaryIcelandIndiaIndonesiaIran, Islamic Rep.IraqIrelandItalyJamaicaJapanJordanKazakhstanKenyaKiribatiKorea, Rep.KosovoKuwaitKyrgyz RepublicLao PDRLatviaLebanonLesothoLiberiaLibyaLithuaniaLuxembourgMacao SAR, ChinaMacedonia, FYRMadagascarMalawiMalaysiaMaldivesMaliMaltaMarshall IslandsMauritaniaMauritiusMexicoMicronesia, Fed. Sts.MoldovaMongoliaMontenegroMoroccoMozambiqueMyanmarNamibiaNepalNetherlandsNew CaledoniaNew ZealandNicaraguaNigerNigeriaNorwayOmanPakistanPalauPanamaPapua New GuineaParaguayPeruPhilippinesPolandPortugalPuerto RicoQatarRomaniaRussian FederationRwandaSamoaSao Tome and PrincipeSaudi ArabiaSenegalSerbiaSeychellesSierra LeoneSingaporeSlovak RepublicSloveniaSolomon IslandsSomaliaSouth AfricaSpainSri LankaSt. Kitts and NevisSt. LuciaSt. Vincent and the GrenadinesSudanSurinameSwazilandSwedenSwitzerlandSyrian Arab RepublicTajikistanTanzaniaThailandTimor-LesteTogoTongaTrinidad and TobagoTunisiaTurkeyTurkmenistanTuvaluUgandaUkraineUnited Arab EmiratesUnited KingdomUnited StatesUruguayUzbekistanVanuatuVenezuela, RBVietnamWest Bank and GazaYemen, Rep.ZambiaZimbabwe

línea de tiempo (timeline):

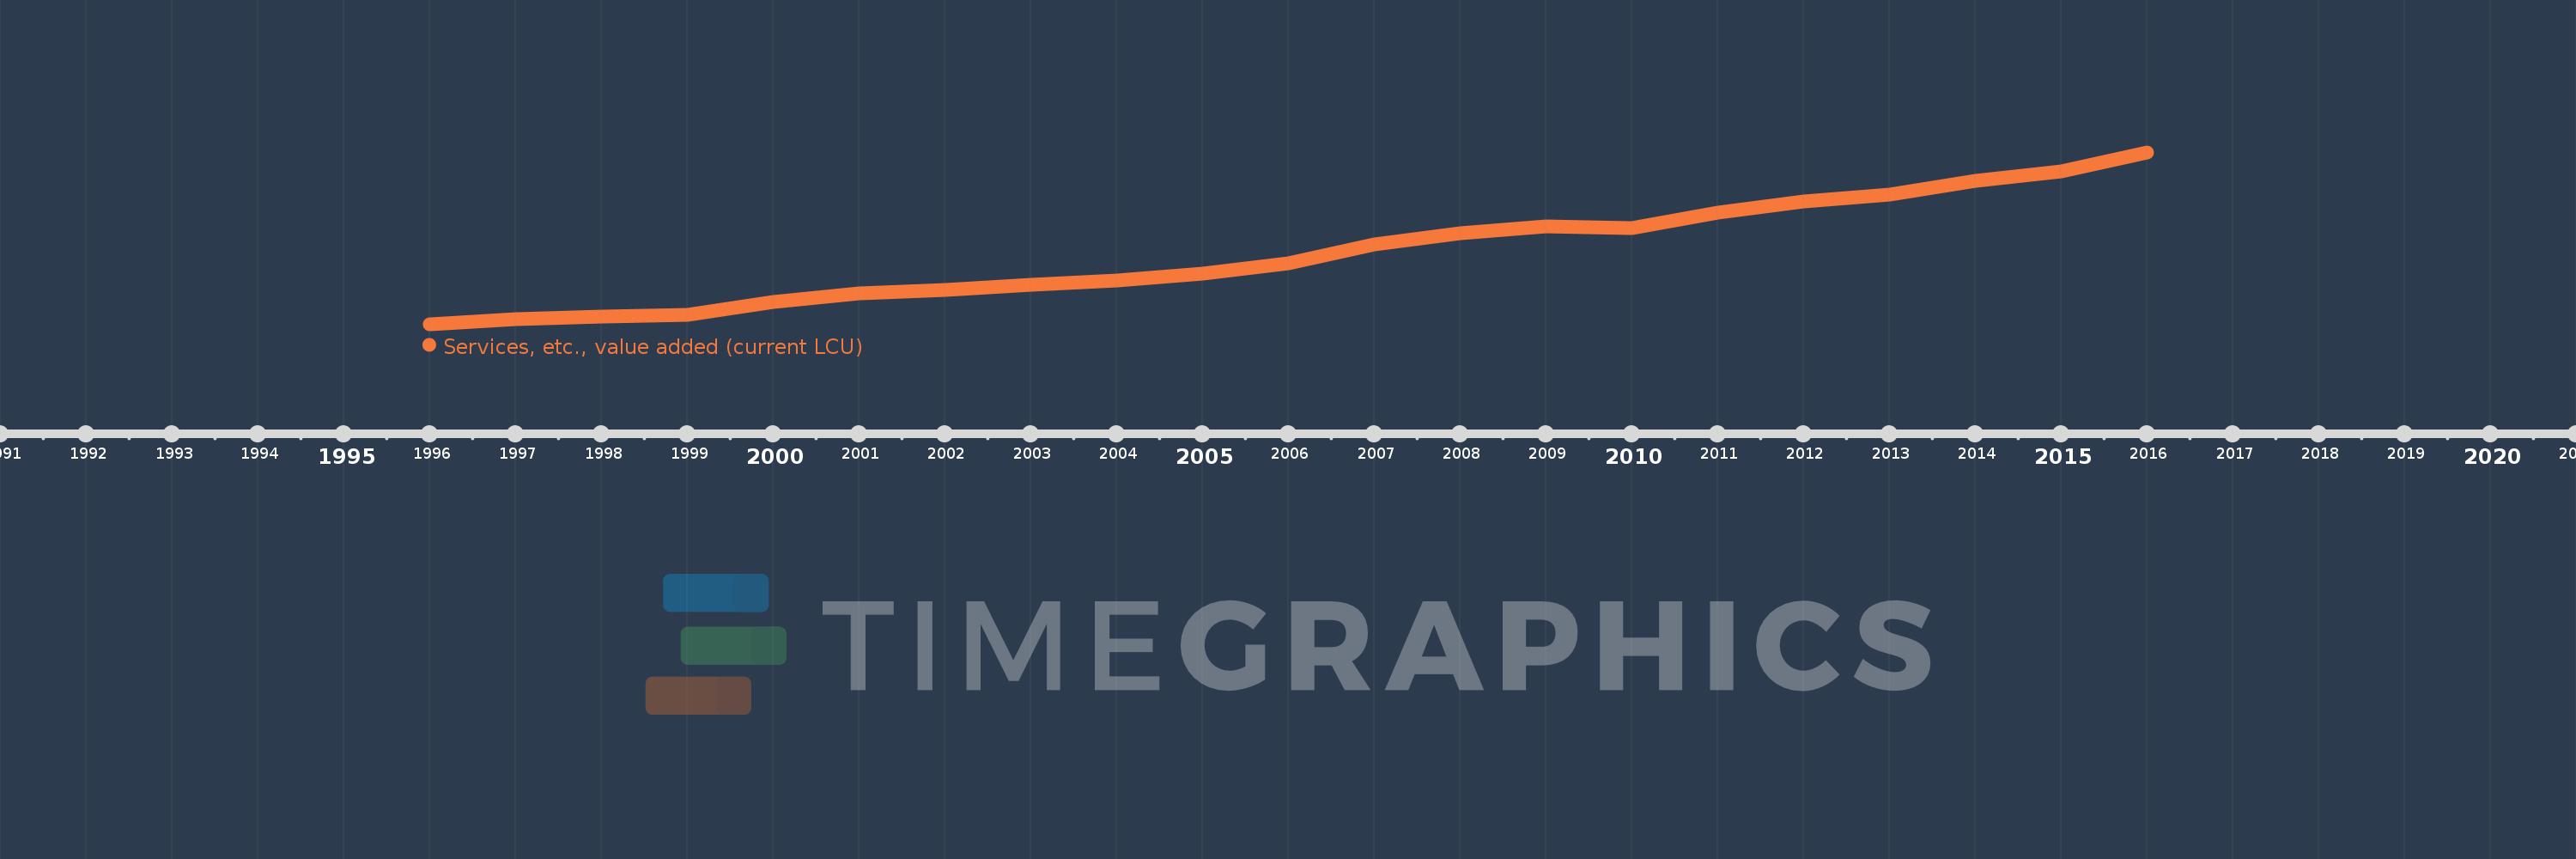
En esta escala de tiempo se presenta un gráfico de 1996 y 2016 de Luxembourg. Los datos de 1995 están ausentes. El número de observaciones reales por fecha: 21.

Fuente (nombre):

Indicadores del desarrollo mundial

Fuente (organización):

World Bank national accounts data, and OECD National Accounts data files.

Categorías:

Economy & Growth

Se ha actualizado:

23 abr 2017 año

Los indicadores de los cambios de valor en los últimos años

En promedio:
23.848 bn
Mínimo:
11.09 bn
1 ene 1996 año
Máximo:
41.763 bn
1 ene 2016 año
A la fecha de observación
Valor
Cambio absoluto
El cambio con respecto al valor anterior
1 ene 1996 año
11.09 bn
+11.09 bn
0.0%
1 ene 1997 año
12.065 bn
+974.531 millones
8.79%
1 ene 1998 año
12.441 bn
+375.96 millones
3.12%
1 ene 1999 año
12.778 bn
+337.584 millones
2.71%
1 ene 2000 año
15.007 bn
+2.229 bn
17.44%
1 ene 2001 año
16.54 bn
+1.532 bn
10.21%
1 ene 2002 año
17.18 bn
+640.468 millones
3.87%
1 ene 2003 año
18.117 bn
+936.7 millones
5.45%
1 ene 2004 año
18.869 bn
+751.9 millones
4.15%
1 ene 2005 año
20.13 bn
+1.262 bn
6.69%
1 ene 2006 año
22.003 bn
+1.873 bn
9.31%
1 ene 2007 año
25.362 bn
+3.359 bn
15.27%
1 ene 2008 año
27.374 bn
+2.012 bn
7.93%
1 ene 2009 año
28.588 bn
+1.214 bn
4.43%
1 ene 2010 año
28.297 bn
-290.9 millones
-1.02%
1 ene 2011 año
30.985 bn
+2.688 bn
9.5%
1 ene 2012 año
33.016 bn
+2.031 bn
6.56%
1 ene 2013 año
34.156 bn
+1.14 bn
3.45%
1 ene 2014 año
36.723 bn
+2.567 bn
7.52%
1 ene 2015 año
38.324 bn
+1.601 bn
4.36%
1 ene 2016 año
41.763 bn
+3.438 bn
8.97%

Ranking de los países por los datos estadísticos actuales