33
/es/
AIzaSyAYiBZKx7MnpbEhh9jyipgxe19OcubqV5w
August 1, 2025
183329
Macao SAR, China
MAC
true
2
1
Services, etc., value added (current LCU)
2013,2012,2011,2010,2009,2008,2007,2006,2005,2004,2003,2002,2001,2000,1999,1998,1997,1996,1995,1994,1993,1992
Download
Estadísticas Globales de la Biblioteca →Macao SAR, China →

Services, etc., value added (current LCU)

Estas estadísticas en otros países:

AfghanistanAlbaniaAlgeriaAndorraAngolaAntigua and BarbudaArgentinaArmeniaArubaAustraliaAustriaAzerbaijanBahamas, TheBahrainBangladeshBarbadosBelarusBelgiumBelizeBeninBermudaBhutanBoliviaBosnia and HerzegovinaBotswanaBrazilBrunei DarussalamBulgariaBurkina FasoBurundiCabo VerdeCambodiaCameroonCanadaCentral African RepublicChadChileChinaColombiaComorosCongo, Dem. Rep.Congo, Rep.Costa RicaCote d'IvoireCroatiaCubaCyprusCzech RepublicDenmarkDjiboutiDominicaDominican RepublicEcuadorEgypt, Arab Rep.El SalvadorEquatorial GuineaEritreaEstoniaEthiopiaFaroe IslandsFijiFinlandFranceGabonGambia, TheGeorgiaGermanyGhanaGreeceGrenadaGuatemalaGuineaGuinea-BissauGuyanaHondurasHong Kong SAR, ChinaHungaryIcelandIndiaIndonesiaIran, Islamic Rep.IraqIrelandItalyJamaicaJapanJordanKazakhstanKenyaKiribatiKorea, Rep.KosovoKuwaitKyrgyz RepublicLao PDRLatviaLebanonLesothoLiberiaLibyaLithuaniaLuxembourgMacao SAR, ChinaMacedonia, FYRMadagascarMalawiMalaysiaMaldivesMaliMaltaMarshall IslandsMauritaniaMauritiusMexicoMicronesia, Fed. Sts.MoldovaMongoliaMontenegroMoroccoMozambiqueMyanmarNamibiaNepalNetherlandsNew CaledoniaNew ZealandNicaraguaNigerNigeriaNorwayOmanPakistanPalauPanamaPapua New GuineaParaguayPeruPhilippinesPolandPortugalPuerto RicoQatarRomaniaRussian FederationRwandaSamoaSao Tome and PrincipeSaudi ArabiaSenegalSerbiaSeychellesSierra LeoneSingaporeSlovak RepublicSloveniaSolomon IslandsSomaliaSouth AfricaSpainSri LankaSt. Kitts and NevisSt. LuciaSt. Vincent and the GrenadinesSudanSurinameSwazilandSwedenSwitzerlandSyrian Arab RepublicTajikistanTanzaniaThailandTimor-LesteTogoTongaTrinidad and TobagoTunisiaTurkeyTurkmenistanTuvaluUgandaUkraineUnited Arab EmiratesUnited KingdomUnited StatesUruguayUzbekistanVanuatuVenezuela, RBVietnamWest Bank and GazaYemen, Rep.ZambiaZimbabwe

línea de tiempo (timeline):

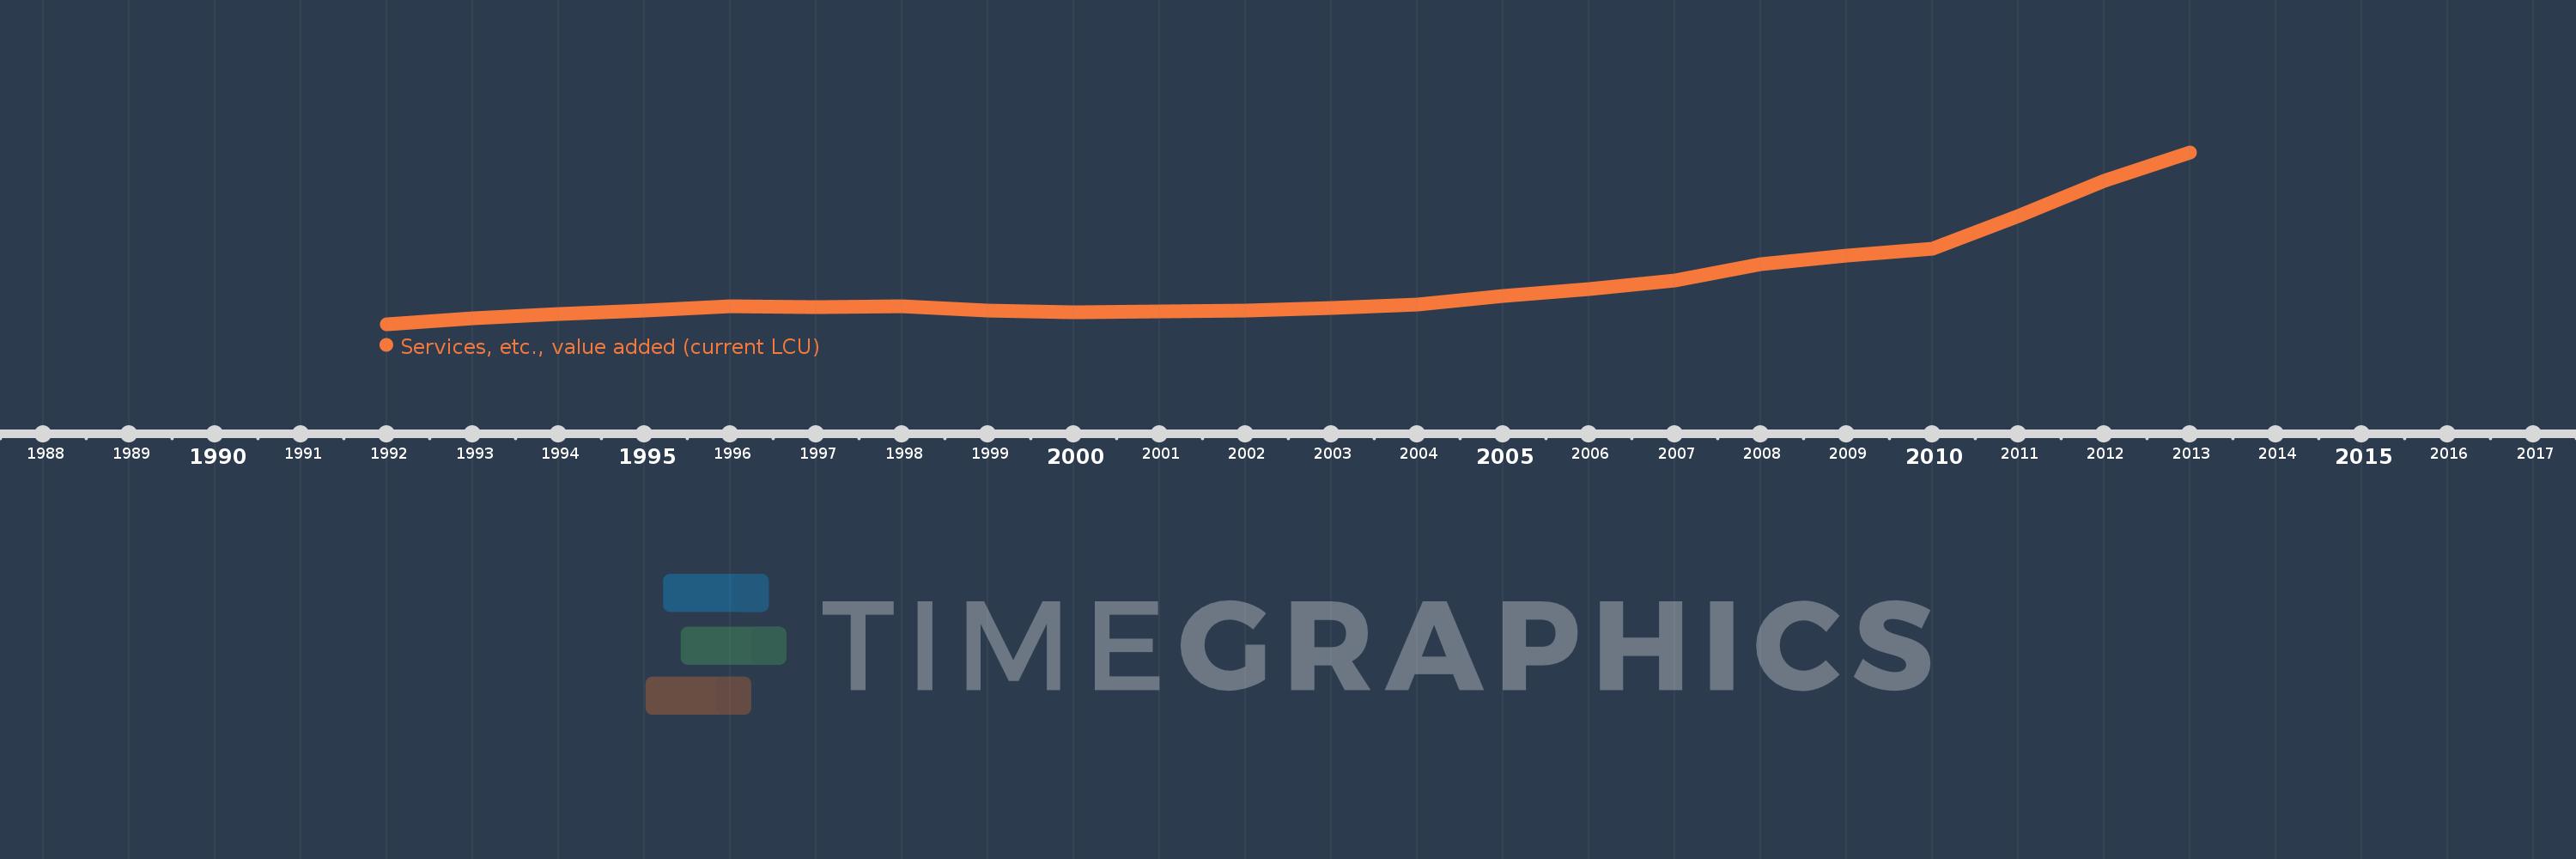
En esta escala de tiempo se presenta un gráfico de 1992 y 2013 de Macao SAR, China. Los datos de 1991 están ausentes. El número de observaciones reales por fecha: 22.

Fuente (nombre):

Indicadores del desarrollo mundial

Fuente (organización):

World Bank national accounts data, and OECD National Accounts data files.

Categorías:

Economy & Growth

Se ha actualizado:

23 abr 2017 año

Los indicadores de los cambios de valor en los últimos años

En promedio:
65.676 bn
Mínimo:
21.403 bn
1 ene 1992 año
Máximo:
205.93 bn
1 ene 2013 año
A la fecha de observación
Valor
Cambio absoluto
El cambio con respecto al valor anterior
1 ene 1992 año
21.403 bn
+21.403 bn
0.0%
1 ene 1993 año
28.048 bn
+6.645 bn
31.05%
1 ene 1994 año
32.561 bn
+4.513 bn
16.09%
1 ene 1995 año
36.426 bn
+3.865 bn
11.87%
1 ene 1996 año
40.977 bn
+4.55 bn
12.49%
1 ene 1997 año
40.087 bn
-889.2 millones
-2.17%
1 ene 1998 año
40.677 bn
+589.3 millones
1.47%
1 ene 1999 año
35.86 bn
-4.817 bn
-11.84%
1 ene 2000 año
34.274 bn
-1.586 bn
-4.42%
1 ene 2001 año
35.598 bn
+1.324 bn
3.86%
1 ene 2002 año
35.768 bn
+170.7 millones
0.48%
1 ene 2003 año
38.98 bn
+3.212 bn
8.98%
1 ene 2004 año
42.413 bn
+3.433 bn
8.81%
1 ene 2005 año
51.56 bn
+9.146 bn
21.57%
1 ene 2006 año
59.288 bn
+7.728 bn
14.99%
1 ene 2007 año
68.026 bn
+8.738 bn
14.74%
1 ene 2008 año
86.151 bn
+18.125 bn
26.64%
1 ene 2009 año
95.204 bn
+9.054 bn
10.51%
1 ene 2010 año
102.816 bn
+7.611 bn
7.99%
1 ene 2011 año
137.115 bn
+34.3 bn
33.36%
1 ene 2012 año
175.701 bn
+38.586 bn
28.14%
1 ene 2013 año
205.93 bn
+30.229 bn
17.2%

Ranking de los países por los datos estadísticos actuales