33
/es/
AIzaSyAYiBZKx7MnpbEhh9jyipgxe19OcubqV5w
August 1, 2025
226402
Portugal
PRT
true
2
1
Services, etc., value added (current LCU)
2016,2015,2014,2013,2012,2011,2010,2009,2008,2007,2006,2005,2004,2003,2002,2001,2000,1999,1998,1997,1996
Download
Estadísticas Globales de la Biblioteca →Portugal →

Services, etc., value added (current LCU)

Estas estadísticas en otros países:

AfghanistanAlbaniaAlgeriaAndorraAngolaAntigua and BarbudaArgentinaArmeniaArubaAustraliaAustriaAzerbaijanBahamas, TheBahrainBangladeshBarbadosBelarusBelgiumBelizeBeninBermudaBhutanBoliviaBosnia and HerzegovinaBotswanaBrazilBrunei DarussalamBulgariaBurkina FasoBurundiCabo VerdeCambodiaCameroonCanadaCentral African RepublicChadChileChinaColombiaComorosCongo, Dem. Rep.Congo, Rep.Costa RicaCote d'IvoireCroatiaCubaCyprusCzech RepublicDenmarkDjiboutiDominicaDominican RepublicEcuadorEgypt, Arab Rep.El SalvadorEquatorial GuineaEritreaEstoniaEthiopiaFaroe IslandsFijiFinlandFranceGabonGambia, TheGeorgiaGermanyGhanaGreeceGrenadaGuatemalaGuineaGuinea-BissauGuyanaHondurasHong Kong SAR, ChinaHungaryIcelandIndiaIndonesiaIran, Islamic Rep.IraqIrelandItalyJamaicaJapanJordanKazakhstanKenyaKiribatiKorea, Rep.KosovoKuwaitKyrgyz RepublicLao PDRLatviaLebanonLesothoLiberiaLibyaLithuaniaLuxembourgMacao SAR, ChinaMacedonia, FYRMadagascarMalawiMalaysiaMaldivesMaliMaltaMarshall IslandsMauritaniaMauritiusMexicoMicronesia, Fed. Sts.MoldovaMongoliaMontenegroMoroccoMozambiqueMyanmarNamibiaNepalNetherlandsNew CaledoniaNew ZealandNicaraguaNigerNigeriaNorwayOmanPakistanPalauPanamaPapua New GuineaParaguayPeruPhilippinesPolandPortugalPuerto RicoQatarRomaniaRussian FederationRwandaSamoaSao Tome and PrincipeSaudi ArabiaSenegalSerbiaSeychellesSierra LeoneSingaporeSlovak RepublicSloveniaSolomon IslandsSomaliaSouth AfricaSpainSri LankaSt. Kitts and NevisSt. LuciaSt. Vincent and the GrenadinesSudanSurinameSwazilandSwedenSwitzerlandSyrian Arab RepublicTajikistanTanzaniaThailandTimor-LesteTogoTongaTrinidad and TobagoTunisiaTurkeyTurkmenistanTuvaluUgandaUkraineUnited Arab EmiratesUnited KingdomUnited StatesUruguayUzbekistanVanuatuVenezuela, RBVietnamWest Bank and GazaYemen, Rep.ZambiaZimbabwe

línea de tiempo (timeline):

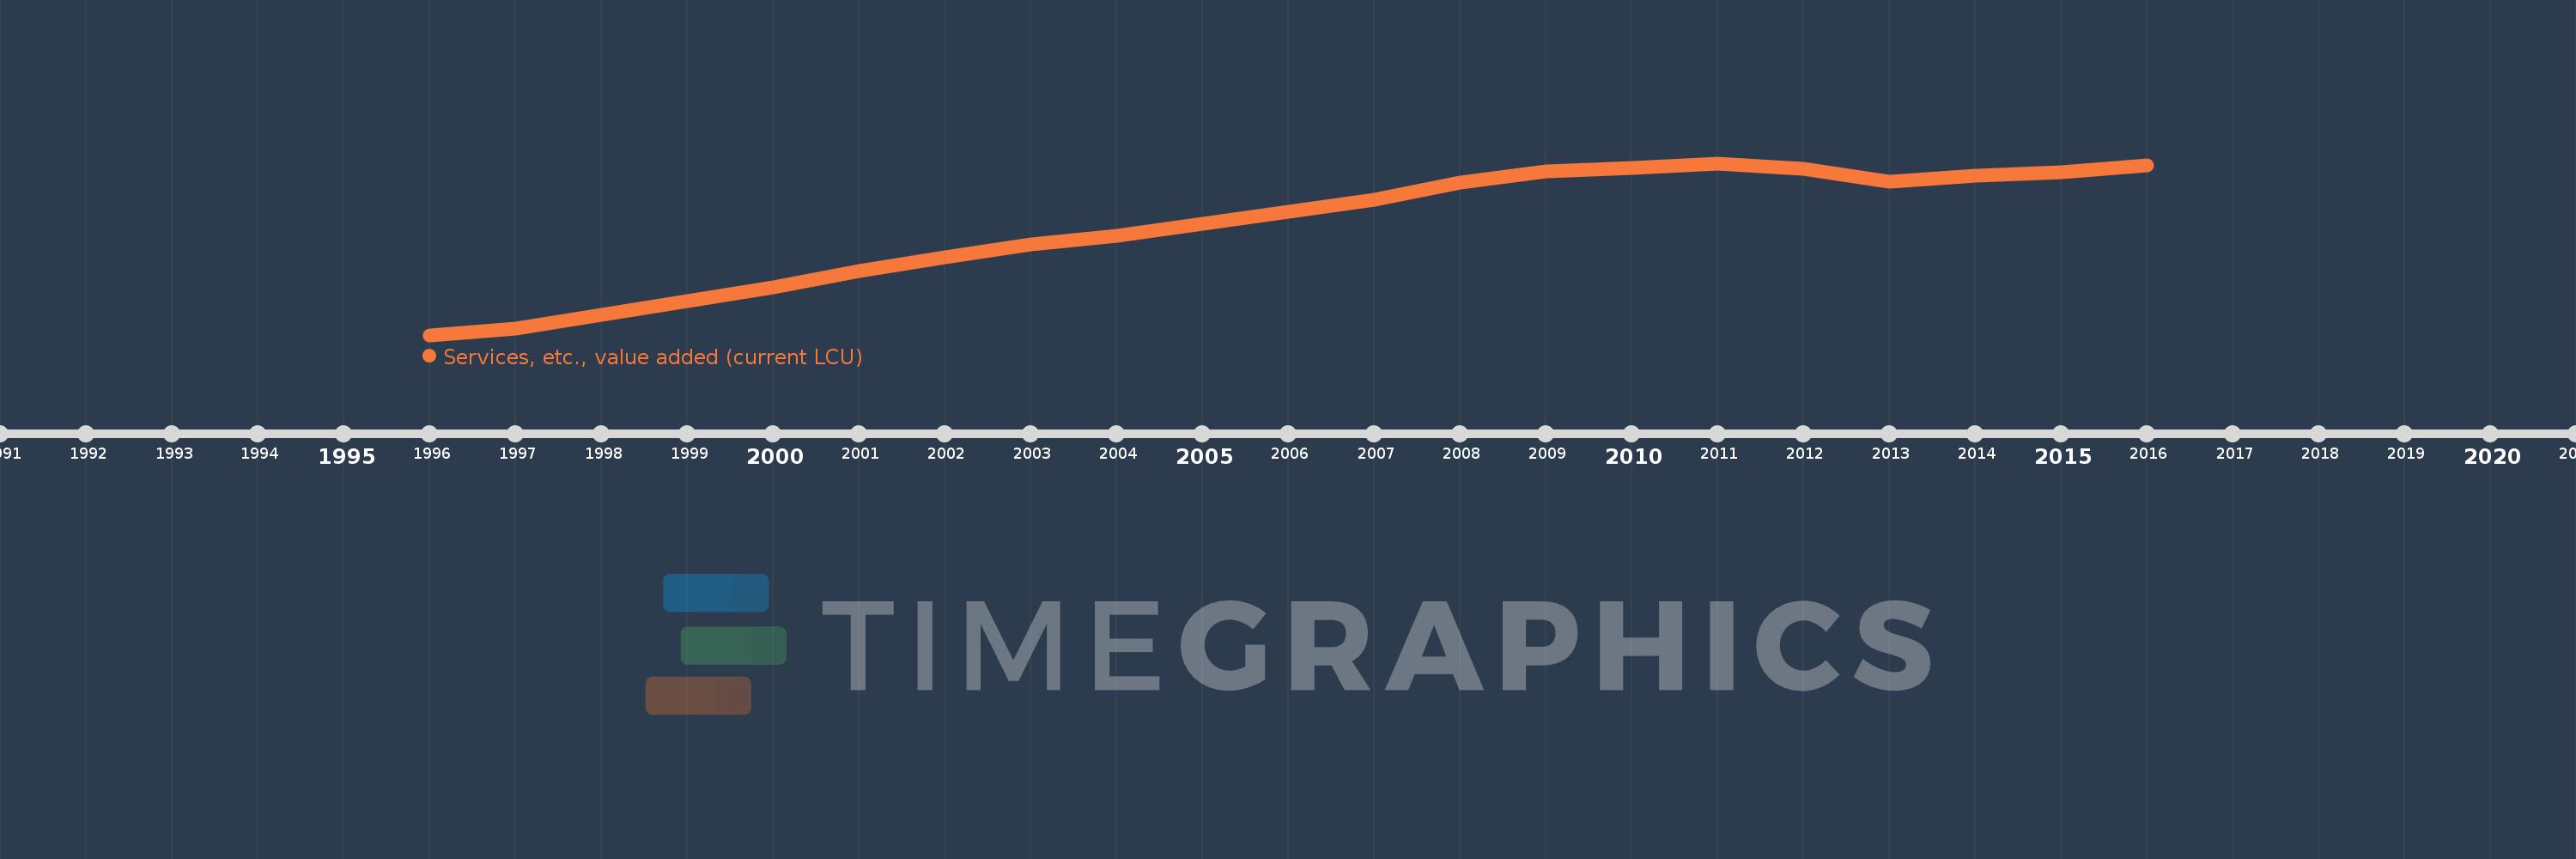
En esta escala de tiempo se presenta un gráfico de 1996 y 2016 de Portugal. Los datos de 1995 están ausentes. El número de observaciones reales por fecha: 21.

Fuente (nombre):

Indicadores del desarrollo mundial

Fuente (organización):

World Bank national accounts data, and OECD National Accounts data files.

Categorías:

Economy & Growth

Se ha actualizado:

23 abr 2017 año

Los indicadores de los cambios de valor en los últimos años

En promedio:
94.331 bn
Mínimo:
52.101 bn
1 ene 1996 año
Máximo:
119.043 bn
1 ene 2011 año
A la fecha de observación
Valor
Cambio absoluto
El cambio con respecto al valor anterior
1 ene 1996 año
52.101 bn
+52.101 bn
0.0%
1 ene 1997 año
54.565 bn
+2.464 bn
4.73%
1 ene 1998 año
59.84 bn
+5.275 bn
9.67%
1 ene 1999 año
65.233 bn
+5.393 bn
9.01%
1 ene 2000 año
70.586 bn
+5.352 bn
8.2%
1 ene 2001 año
77.166 bn
+6.58 bn
9.32%
1 ene 2002 año
82.352 bn
+5.186 bn
6.72%
1 ene 2003 año
87.419 bn
+5.067 bn
6.15%
1 ene 2004 año
90.896 bn
+3.477 bn
3.98%
1 ene 2005 año
95.462 bn
+4.566 bn
5.02%
1 ene 2006 año
100.058 bn
+4.596 bn
4.81%
1 ene 2007 año
104.687 bn
+4.629 bn
4.63%
1 ene 2008 año
111.566 bn
+6.879 bn
6.57%
1 ene 2009 año
115.953 bn
+4.387 bn
3.93%
1 ene 2010 año
117.269 bn
+1.316 bn
1.14%
1 ene 2011 año
119.043 bn
+1.773 bn
1.51%
1 ene 2012 año
116.982 bn
-2.061 bn
-1.73%
1 ene 2013 año
111.987 bn
-4.995 bn
-4.27%
1 ene 2014 año
114.076 bn
+2.089 bn
1.87%
1 ene 2015 año
115.498 bn
+1.422 bn
1.25%
1 ene 2016 año
118.213 bn
+2.715 bn
2.35%

Ranking de los países por los datos estadísticos actuales