33
/es/
AIzaSyAYiBZKx7MnpbEhh9jyipgxe19OcubqV5w
August 1, 2025
81260
Belarus
BLR
true
2
1
Short-term debt (% of total reserves)
2016,2015,2014,2013,2012,2011,2010,2009,2008,2007,2006,2005,2004,2003,2002,2001,2000,1999,1998,1997,1996,1995
Download
Estadísticas Globales de la Biblioteca →Belarus →

Short-term debt (% of total reserves)

Estas estadísticas en otros países:

AfghanistanAlbaniaAlgeriaAngolaArgentinaArmeniaAzerbaijanBangladeshBelarusBelizeBeninBhutanBoliviaBosnia and HerzegovinaBotswanaBrazilBulgariaBurkina FasoBurundiCabo VerdeCambodiaCameroonCentral African RepublicCentral Europe and the BalticsChadChinaColombiaComorosCongo, Dem. Rep.Congo, Rep.Costa RicaCote d'IvoireDjiboutiDominicaDominican RepublicEarly-demographic dividendEast Asia & Pacific (excluding high income)East Asia & Pacific (IDA & IBRD countries)EcuadorEgypt, Arab Rep.El SalvadorEritreaEthiopiaEurope & Central Asia (excluding high income)Europe & Central Asia (IDA & IBRD countries)FijiFragile and conflict affected situationsGabonGambia, TheGeorgiaGhanaGrenadaGuatemalaGuineaGuinea-BissauGuyanaHaitiHeavily indebted poor countries (HIPC)HondurasIBRD onlyIDA & IBRD totalIDA blendIDA onlyIDA totalIndiaIndonesiaIran, Islamic Rep.JamaicaJordanKazakhstanKenyaKosovoKyrgyz RepublicLao PDRLate-demographic dividendLatin America & Caribbean Latin America & Caribbean (excluding high income)Latin America & the Caribbean (IDA & IBRD countries)Least developed countries: UN classificationLebanonLesothoLiberiaLow & middle incomeLow incomeLower middle incomeMacedonia, FYRMadagascarMalawiMalaysiaMaldivesMaliMauritaniaMauritiusMexicoMiddle East & North Africa (excluding high income)Middle East & North Africa (IDA & IBRD countries)Middle incomeMoldovaMongoliaMontenegroMoroccoMozambiqueMyanmarNepalNicaraguaNigerNigeriaPacific island small statesPakistanPanamaPapua New GuineaParaguayPeruPhilippinesPre-demographic dividendRomaniaRussian FederationRwandaSamoaSao Tome and PrincipeSenegalSerbiaSierra LeoneSolomon IslandsSouth AfricaSouth AsiaSouth Asia (IDA & IBRD)Sri LankaSt. LuciaSt. Vincent and the GrenadinesSub-Saharan Africa Sub-Saharan Africa (excluding high income)Sub-Saharan Africa (IDA & IBRD countries)SudanSwazilandSyrian Arab RepublicTajikistanTanzaniaThailandTogoTongaTunisiaTurkeyUgandaUkraineUpper middle incomeVanuatuVenezuela, RBVietnamYemen, Rep.ZambiaZimbabwe

línea de tiempo (timeline):

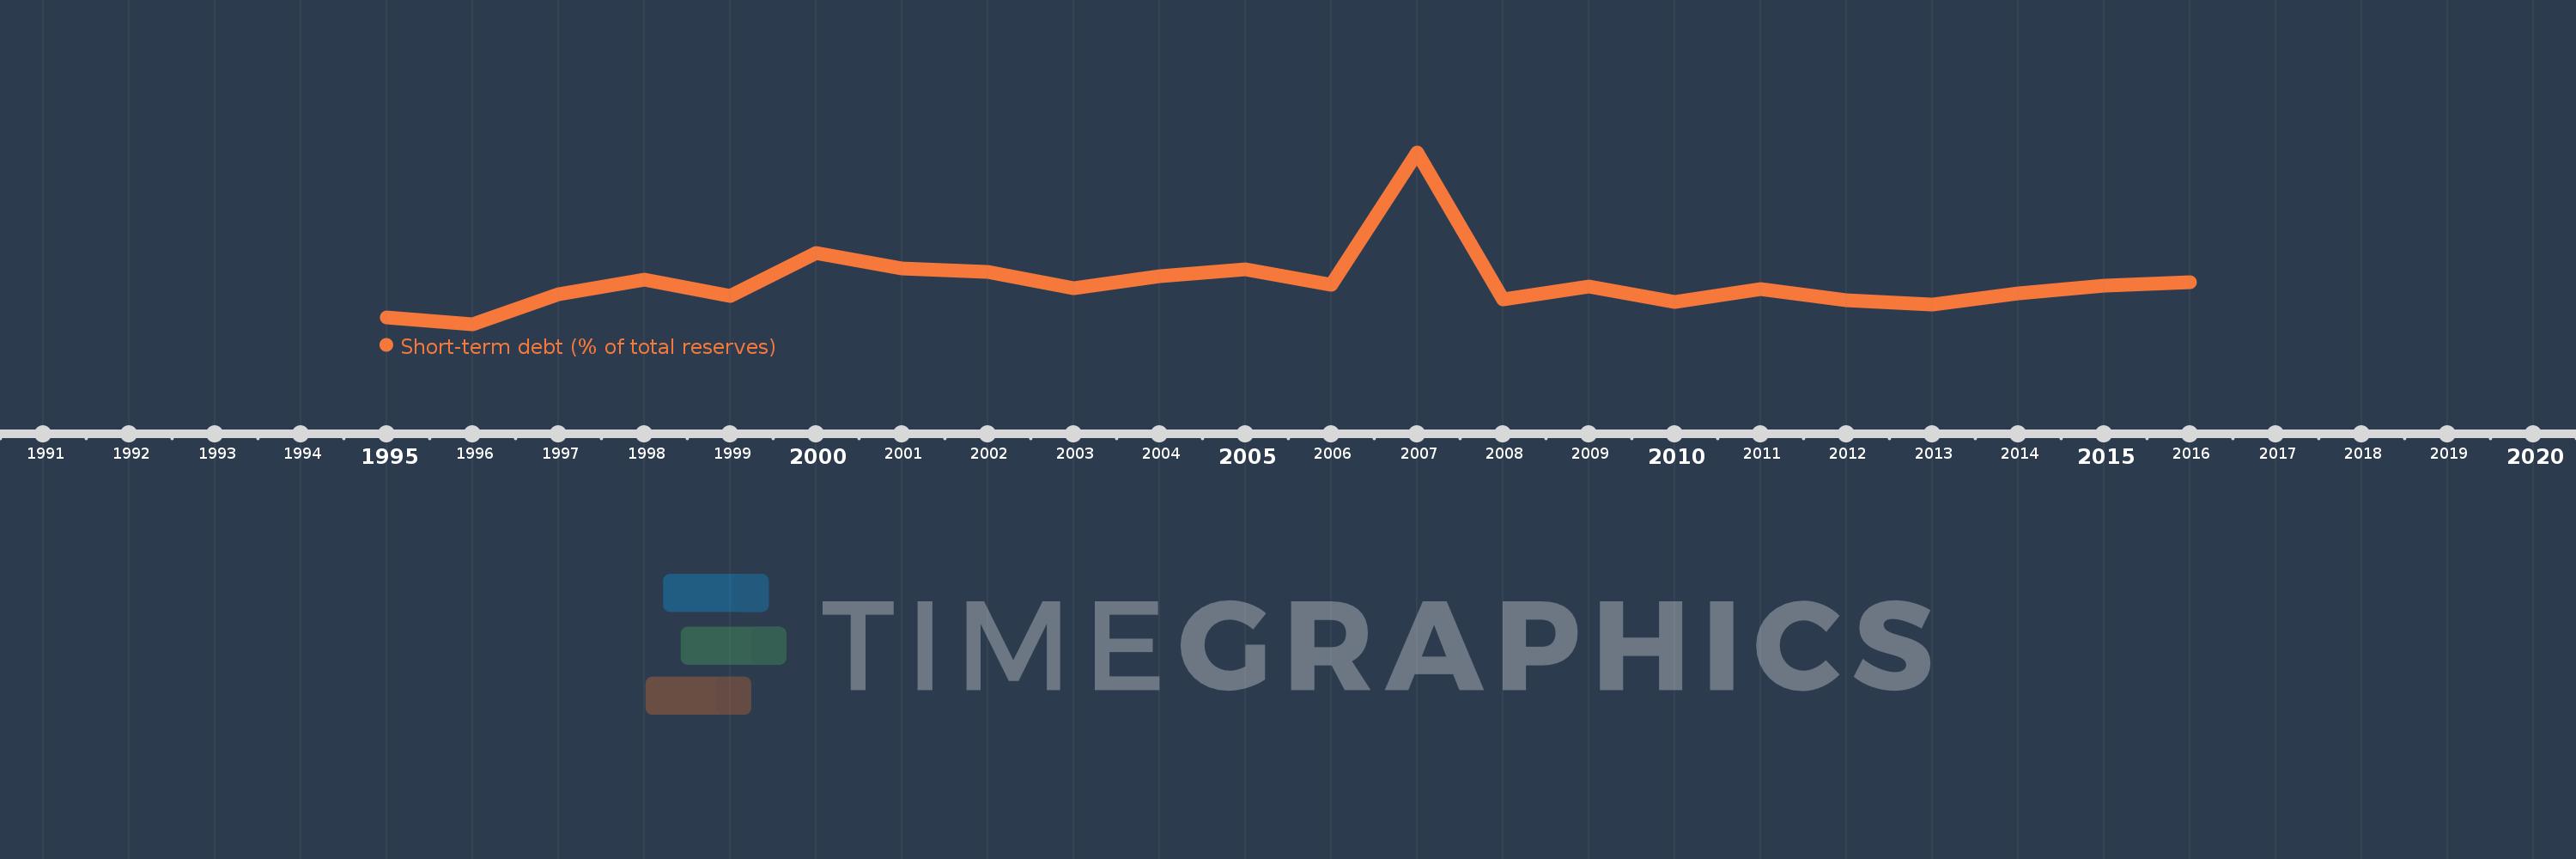
En esta escala de tiempo se presenta un gráfico de 1995 y 2016 de Belarus. Los datos de 1994 están ausentes. El número de observaciones reales por fecha: 22.

Fuente (nombre):

Indicadores del desarrollo mundial

Fuente (organización):

World Bank, International Debt Statistics.

Categorías:

Economy & Growth, External Debt

Se ha actualizado:

23 abr 2017 año

Los indicadores de los cambios de valor en los últimos años

En promedio:
271.959
Mínimo:
29.157
1 ene 1996 año
Máximo:
1.032 mil
1 ene 2007 año
A la fecha de observación
Valor
Cambio absoluto
El cambio con respecto al valor anterior
1 ene 1995 año
69.274
+69.274
0.0%
1 ene 1996 año
29.157
-40.117
-57.91%
1 ene 1997 año
203.895
+174.739
599.31%
1 ene 1998 año
290.655
+86.76
42.55%
1 ene 1999 año
191.751
-98.904
-34.03%
1 ene 2000 año
445.21
+253.459
132.18%
1 ene 2001 año
353.394
-91.816
-20.62%
1 ene 2002 año
334.979
-18.414
-5.21%
1 ene 2003 año
236.995
-97.985
-29.25%
1 ene 2004 año
310.259
+73.265
30.91%
1 ene 2005 año
350.799
+40.54
13.07%
1 ene 2006 año
261.068
-89.731
-25.58%
1 ene 2007 año
1.032 mil
+770.569
295.16%
1 ene 2008 año
176.164
-855.472
-82.92%
1 ene 2009 año
246.738
+70.574
40.06%
1 ene 2010 año
160.918
-85.82
-34.78%
1 ene 2011 año
236.074
+75.156
46.7%
1 ene 2012 año
170.991
-65.083
-27.57%
1 ene 2013 año
143.735
-27.256
-15.94%
1 ene 2014 año
211.298
+67.564
47.01%
1 ene 2015 año
253.12
+41.822
19.79%
1 ene 2016 año
274.983
+21.863
8.64%

Ranking de los países por los datos estadísticos actuales