33
/es/
AIzaSyAYiBZKx7MnpbEhh9jyipgxe19OcubqV5w
August 1, 2025
285298
Yemen, Rep.
YEM
true
2
1
Short-term debt (% of total reserves)
2014,2013,2012,2011,2010,2009,2008,2007,2006,2005,2004,2003,2002,2001,2000,1999,1998,1997,1996,1995,1994,1993,1992,1991
Download
Estadísticas Globales de la Biblioteca →Yemen, Rep. →

Short-term debt (% of total reserves)

Estas estadísticas en otros países:

AfghanistanAlbaniaAlgeriaAngolaArgentinaArmeniaAzerbaijanBangladeshBelarusBelizeBeninBhutanBoliviaBosnia and HerzegovinaBotswanaBrazilBulgariaBurkina FasoBurundiCabo VerdeCambodiaCameroonCentral African RepublicCentral Europe and the BalticsChadChinaColombiaComorosCongo, Dem. Rep.Congo, Rep.Costa RicaCote d'IvoireDjiboutiDominicaDominican RepublicEarly-demographic dividendEast Asia & Pacific (excluding high income)East Asia & Pacific (IDA & IBRD countries)EcuadorEgypt, Arab Rep.El SalvadorEritreaEthiopiaEurope & Central Asia (excluding high income)Europe & Central Asia (IDA & IBRD countries)FijiFragile and conflict affected situationsGabonGambia, TheGeorgiaGhanaGrenadaGuatemalaGuineaGuinea-BissauGuyanaHaitiHeavily indebted poor countries (HIPC)HondurasIBRD onlyIDA & IBRD totalIDA blendIDA onlyIDA totalIndiaIndonesiaIran, Islamic Rep.JamaicaJordanKazakhstanKenyaKosovoKyrgyz RepublicLao PDRLate-demographic dividendLatin America & Caribbean Latin America & Caribbean (excluding high income)Latin America & the Caribbean (IDA & IBRD countries)Least developed countries: UN classificationLebanonLesothoLiberiaLow & middle incomeLow incomeLower middle incomeMacedonia, FYRMadagascarMalawiMalaysiaMaldivesMaliMauritaniaMauritiusMexicoMiddle East & North Africa (excluding high income)Middle East & North Africa (IDA & IBRD countries)Middle incomeMoldovaMongoliaMontenegroMoroccoMozambiqueMyanmarNepalNicaraguaNigerNigeriaPacific island small statesPakistanPanamaPapua New GuineaParaguayPeruPhilippinesPre-demographic dividendRomaniaRussian FederationRwandaSamoaSao Tome and PrincipeSenegalSerbiaSierra LeoneSolomon IslandsSouth AfricaSouth AsiaSouth Asia (IDA & IBRD)Sri LankaSt. LuciaSt. Vincent and the GrenadinesSub-Saharan Africa Sub-Saharan Africa (excluding high income)Sub-Saharan Africa (IDA & IBRD countries)SudanSwazilandSyrian Arab RepublicTajikistanTanzaniaThailandTogoTongaTunisiaTurkeyUgandaUkraineUpper middle incomeVanuatuVenezuela, RBVietnamYemen, Rep.ZambiaZimbabwe

línea de tiempo (timeline):

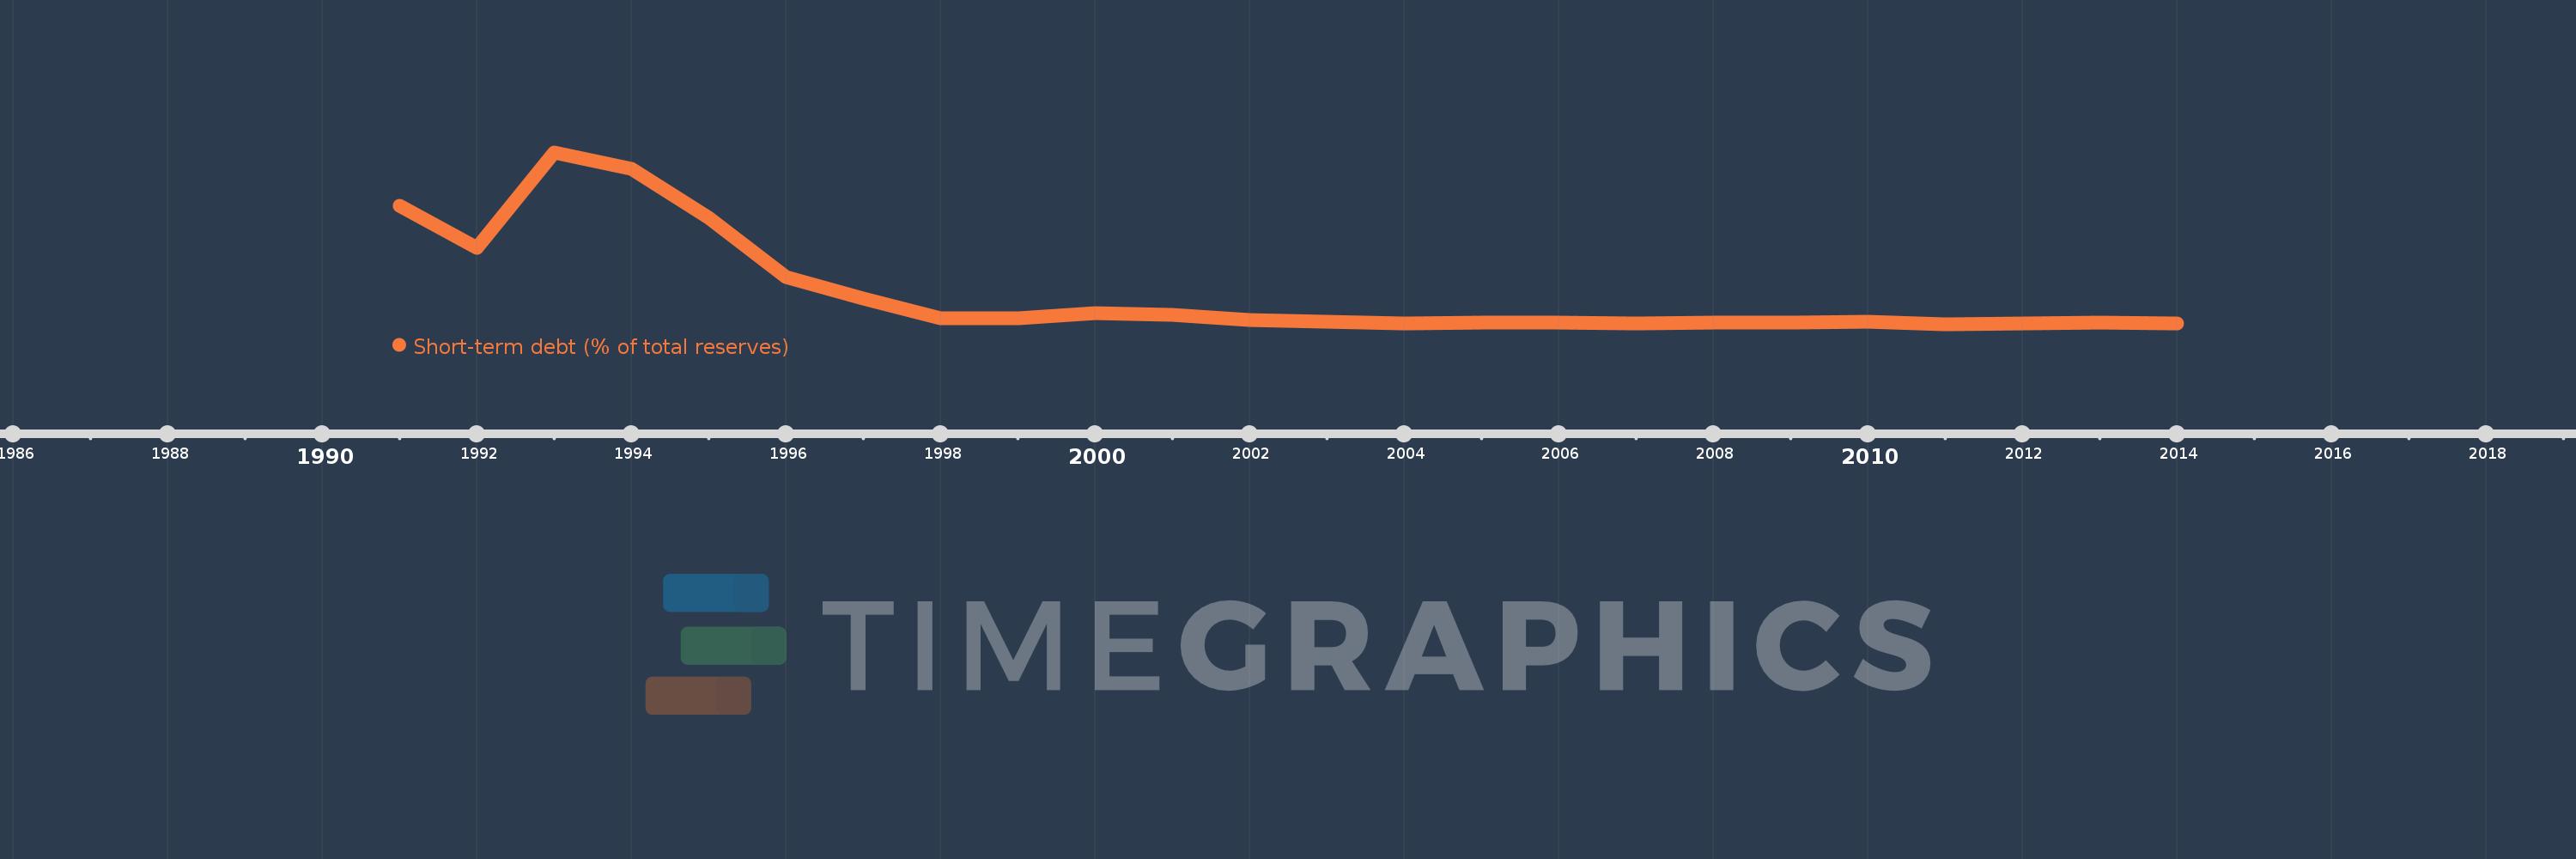
En esta escala de tiempo se presenta un gráfico de 1991 y 2014 de Yemen, Rep.. Los datos de 1990 están ausentes. El número de observaciones reales por fecha: 24.

Fuente (nombre):

Indicadores del desarrollo mundial

Fuente (organización):

World Bank, International Debt Statistics.

Categorías:

Economy & Growth, External Debt

Se ha actualizado:

23 abr 2017 año

Los indicadores de los cambios de valor en los últimos años

En promedio:
72.982
Mínimo:
2.091
1 ene 2011 año
Máximo:
390.877
1 ene 1993 año
A la fecha de observación
Valor
Cambio absoluto
El cambio con respecto al valor anterior
1 ene 1991 año
269.919
+269.919
0.0%
1 ene 1992 año
174.713
-95.206
-35.27%
1 ene 1993 año
390.877
+216.164
123.73%
1 ene 1994 año
352.947
-37.931
-9.7%
1 ene 1995 año
242.95
-109.996
-31.17%
1 ene 1996 año
107.911
-135.04
-55.58%
1 ene 1997 año
59.793
-48.118
-44.59%
1 ene 1998 año
15.6
-44.193
-73.91%
1 ene 1999 año
16.352
+0.752
4.82%
1 ene 2000 año
27.781
+11.43
69.9%
1 ene 2001 año
23.633
-4.148
-14.93%
1 ene 2002 año
11.599
-12.034
-50.92%
1 ene 2003 año
7.383
-4.216
-36.35%
1 ene 2004 año
4.398
-2.985
-40.43%
1 ene 2005 año
5.273
+0.875
19.9%
1 ene 2006 año
5.377
+0.104
1.97%
1 ene 2007 año
4.316
-1.061
-19.73%
1 ene 2008 año
5.368
+1.053
24.39%
1 ene 2009 año
4.825
-0.543
-10.12%
1 ene 2010 año
7.256
+2.431
50.38%
1 ene 2011 año
2.091
-5.165
-71.18%
1 ene 2012 año
2.901
+0.81
38.72%
1 ene 2013 año
4.906
+2.005
69.12%
1 ene 2014 año
3.391
-1.515
-30.88%

Ranking de los países por los datos estadísticos actuales