33
/es/
AIzaSyAYiBZKx7MnpbEhh9jyipgxe19OcubqV5w
May 1, 2025
71880
Armenia
ARM
true
2
1
Short-term debt (% of total reserves)
2016,2015,2014,2013,2012,2011,2010,2009,2008,2007,2006,2005,2004,2003,2002,2001,2000,1999,1998,1997,1996,1995,1994
Download
Estadísticas Globales de la Biblioteca →Armenia →

Short-term debt (% of total reserves)

Estas estadísticas en otros países:

AfghanistanAlbaniaAlgeriaAngolaArgentinaArmeniaAzerbaijanBangladeshBelarusBelizeBeninBhutanBoliviaBosnia and HerzegovinaBotswanaBrazilBulgariaBurkina FasoBurundiCabo VerdeCambodiaCameroonCentral African RepublicCentral Europe and the BalticsChadChinaColombiaComorosCongo, Dem. Rep.Congo, Rep.Costa RicaCote d'IvoireDjiboutiDominicaDominican RepublicEarly-demographic dividendEast Asia & Pacific (excluding high income)East Asia & Pacific (IDA & IBRD countries)EcuadorEgypt, Arab Rep.El SalvadorEritreaEthiopiaEurope & Central Asia (excluding high income)Europe & Central Asia (IDA & IBRD countries)FijiFragile and conflict affected situationsGabonGambia, TheGeorgiaGhanaGrenadaGuatemalaGuineaGuinea-BissauGuyanaHaitiHeavily indebted poor countries (HIPC)HondurasIBRD onlyIDA & IBRD totalIDA blendIDA onlyIDA totalIndiaIndonesiaIran, Islamic Rep.JamaicaJordanKazakhstanKenyaKosovoKyrgyz RepublicLao PDRLate-demographic dividendLatin America & Caribbean Latin America & Caribbean (excluding high income)Latin America & the Caribbean (IDA & IBRD countries)Least developed countries: UN classificationLebanonLesothoLiberiaLow & middle incomeLow incomeLower middle incomeMacedonia, FYRMadagascarMalawiMalaysiaMaldivesMaliMauritaniaMauritiusMexicoMiddle East & North Africa (excluding high income)Middle East & North Africa (IDA & IBRD countries)Middle incomeMoldovaMongoliaMontenegroMoroccoMozambiqueMyanmarNepalNicaraguaNigerNigeriaPacific island small statesPakistanPanamaPapua New GuineaParaguayPeruPhilippinesPre-demographic dividendRomaniaRussian FederationRwandaSamoaSao Tome and PrincipeSenegalSerbiaSierra LeoneSolomon IslandsSouth AfricaSouth AsiaSouth Asia (IDA & IBRD)Sri LankaSt. LuciaSt. Vincent and the GrenadinesSub-Saharan Africa Sub-Saharan Africa (excluding high income)Sub-Saharan Africa (IDA & IBRD countries)SudanSwazilandSyrian Arab RepublicTajikistanTanzaniaThailandTogoTongaTunisiaTurkeyUgandaUkraineUpper middle incomeVanuatuVenezuela, RBVietnamYemen, Rep.ZambiaZimbabwe

línea de tiempo (timeline):

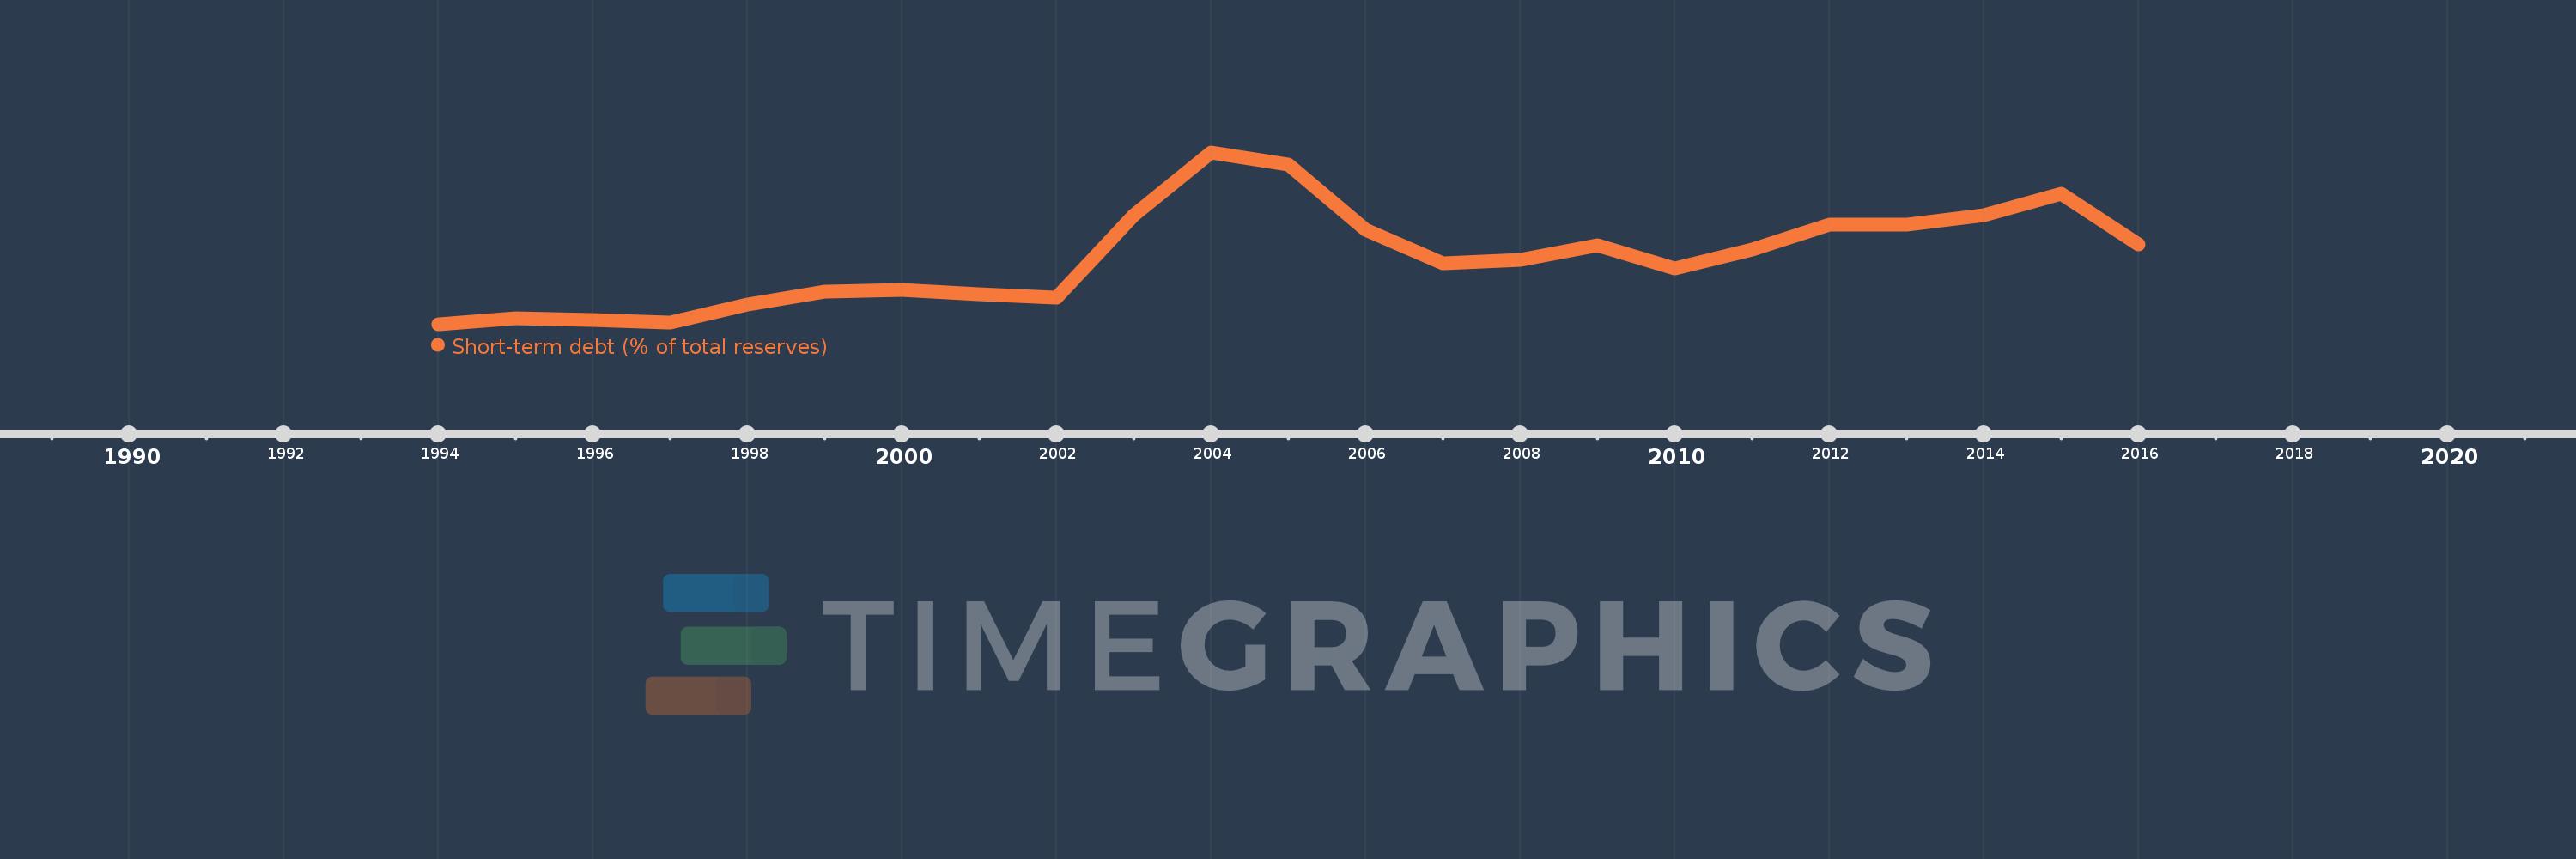
En esta escala de tiempo se presenta un gráfico de 1994 y 2016 de Armenia. Los datos de 1993 están ausentes. El número de observaciones reales por fecha: 23.

Fuente (nombre):

Indicadores del desarrollo mundial

Fuente (organización):

World Bank, International Debt Statistics.

Categorías:

Economy & Growth, External Debt

Se ha actualizado:

23 abr 2017 año

Los indicadores de los cambios de valor en los últimos años

En promedio:
31.512
Mínimo:
0.147
1 ene 1994 año
Máximo:
80.482
1 ene 2004 año
A la fecha de observación
Valor
Cambio absoluto
El cambio con respecto al valor anterior
1 ene 1994 año
0.147
+0.147
0.0%
1 ene 1995 año
2.955
+2.808
1.91 mil%
1 ene 1996 año
1.925
-1.03
-34.86%
1 ene 1997 año
0.832
-1.092
-56.76%
1 ene 1998 año
9.196
+8.364
1.0 mil%
1 ene 1999 año
15.408
+6.211
67.54%
1 ene 2000 año
16.21
+0.802
5.21%
1 ene 2001 año
14.137
-2.073
-12.79%
1 ene 2002 año
12.733
-1.404
-9.93%
1 ene 2003 año
51.047
+38.314
300.91%
1 ene 2004 año
80.482
+29.435
57.66%
1 ene 2005 año
74.85
-5.631
-7.0%
1 ene 2006 año
44.49
-30.361
-40.56%
1 ene 2007 año
28.627
-15.863
-35.65%
1 ene 2008 año
30.175
+1.548
5.41%
1 ene 2009 año
37.019
+6.843
22.68%
1 ene 2010 año
26.411
-10.608
-28.66%
1 ene 2011 año
35.145
+8.734
33.07%
1 ene 2012 año
46.763
+11.619
33.06%
1 ene 2013 año
46.796
+0.032
0.07%
1 ene 2014 año
51.069
+4.273
9.13%
1 ene 2015 año
60.977
+9.908
19.4%
1 ene 2016 año
37.383
-23.595
-38.69%

Ranking de los países por los datos estadísticos actuales