33
/es/
AIzaSyAYiBZKx7MnpbEhh9jyipgxe19OcubqV5w
August 1, 2025
26920
Early-demographic dividend
EAR
false
2
1
Short-term debt (% of total reserves)
2008,2007,2006,2005,2004,2003,2002,2001,2000,1999,1998,1997,1996,1995,1994,1993,1992,1991
Download
Estadísticas Globales de la Biblioteca →Early-demographic dividend →

Short-term debt (% of total reserves)

Estas estadísticas en otros países:

AfghanistanAlbaniaAlgeriaAngolaArgentinaArmeniaAzerbaijanBangladeshBelarusBelizeBeninBhutanBoliviaBosnia and HerzegovinaBotswanaBrazilBulgariaBurkina FasoBurundiCabo VerdeCambodiaCameroonCentral African RepublicCentral Europe and the BalticsChadChinaColombiaComorosCongo, Dem. Rep.Congo, Rep.Costa RicaCote d'IvoireDjiboutiDominicaDominican RepublicEarly-demographic dividendEast Asia & Pacific (excluding high income)East Asia & Pacific (IDA & IBRD countries)EcuadorEgypt, Arab Rep.El SalvadorEritreaEthiopiaEurope & Central Asia (excluding high income)Europe & Central Asia (IDA & IBRD countries)FijiFragile and conflict affected situationsGabonGambia, TheGeorgiaGhanaGrenadaGuatemalaGuineaGuinea-BissauGuyanaHaitiHeavily indebted poor countries (HIPC)HondurasIBRD onlyIDA & IBRD totalIDA blendIDA onlyIDA totalIndiaIndonesiaIran, Islamic Rep.JamaicaJordanKazakhstanKenyaKosovoKyrgyz RepublicLao PDRLate-demographic dividendLatin America & Caribbean Latin America & Caribbean (excluding high income)Latin America & the Caribbean (IDA & IBRD countries)Least developed countries: UN classificationLebanonLesothoLiberiaLow & middle incomeLow incomeLower middle incomeMacedonia, FYRMadagascarMalawiMalaysiaMaldivesMaliMauritaniaMauritiusMexicoMiddle East & North Africa (excluding high income)Middle East & North Africa (IDA & IBRD countries)Middle incomeMoldovaMongoliaMontenegroMoroccoMozambiqueMyanmarNepalNicaraguaNigerNigeriaPacific island small statesPakistanPanamaPapua New GuineaParaguayPeruPhilippinesPre-demographic dividendRomaniaRussian FederationRwandaSamoaSao Tome and PrincipeSenegalSerbiaSierra LeoneSolomon IslandsSouth AfricaSouth AsiaSouth Asia (IDA & IBRD)Sri LankaSt. LuciaSt. Vincent and the GrenadinesSub-Saharan Africa Sub-Saharan Africa (excluding high income)Sub-Saharan Africa (IDA & IBRD countries)SudanSwazilandSyrian Arab RepublicTajikistanTanzaniaThailandTogoTongaTunisiaTurkeyUgandaUkraineUpper middle incomeVanuatuVenezuela, RBVietnamYemen, Rep.ZambiaZimbabwe

línea de tiempo (timeline):

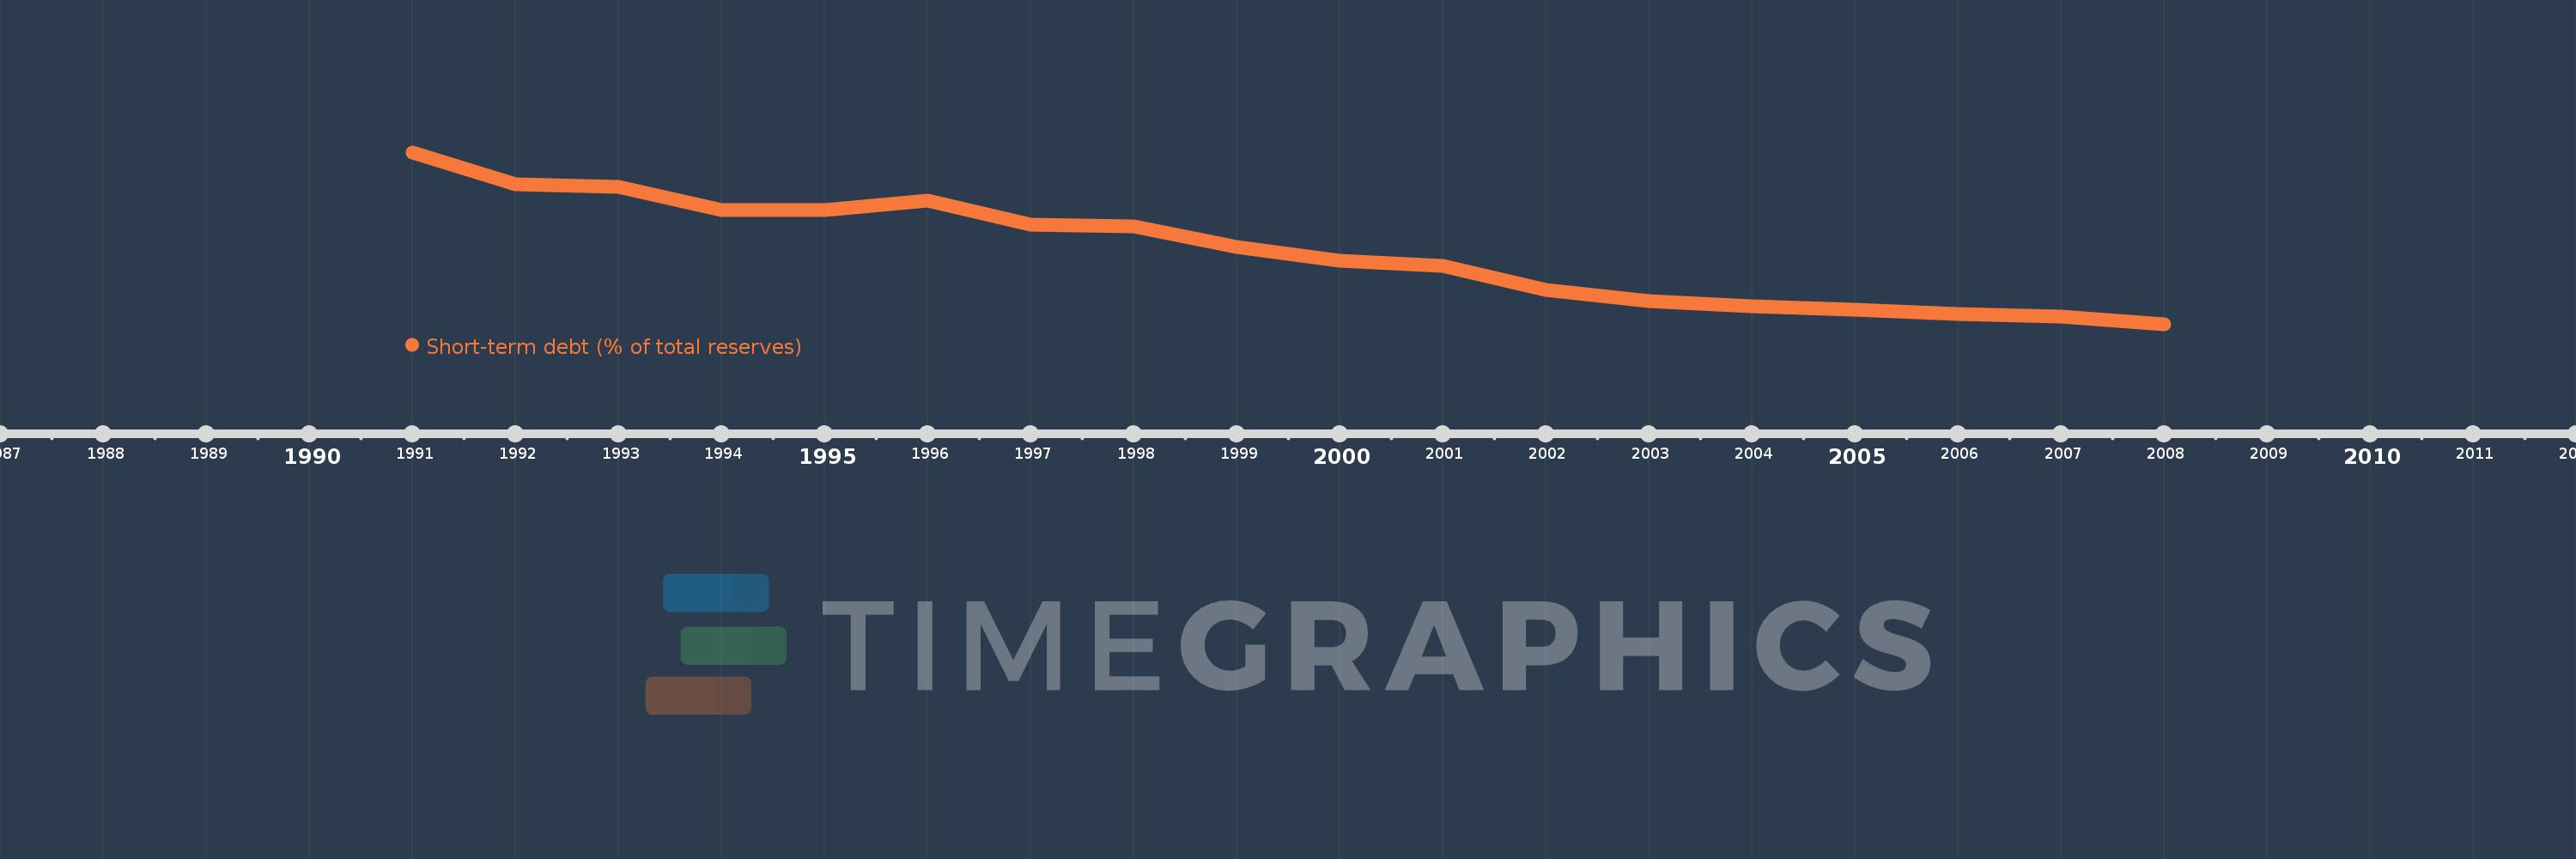
En esta escala de tiempo se presenta un gráfico de 1991 y 2008 de Early-demographic dividend. Los datos de 1990 están ausentes. El número de observaciones reales por fecha: 18.

Fuente (nombre):

Indicadores del desarrollo mundial

Fuente (organización):

World Bank, International Debt Statistics.

Categorías:

Economy & Growth, External Debt

Se ha actualizado:

23 abr 2017 año

Los indicadores de los cambios de valor en los últimos años

En promedio:
65.017
Mínimo:
25.177
1 ene 2008 año
Máximo:
119.57
1 ene 1991 año
A la fecha de observación
Valor
Cambio absoluto
El cambio con respecto al valor anterior
1 ene 1991 año
119.57
+119.57
0.0%
1 ene 1992 año
101.846
-17.724
-14.82%
1 ene 1993 año
100.657
-1.189
-1.17%
1 ene 1994 año
88.083
-12.574
-12.49%
1 ene 1995 año
87.833
-0.25
-0.28%
1 ene 1996 año
93.081
+5.248
5.97%
1 ene 1997 año
79.893
-13.188
-14.17%
1 ene 1998 año
78.882
-1.011
-1.27%
1 ene 1999 año
67.786
-11.096
-14.07%
1 ene 2000 año
60.083
-7.703
-11.36%
1 ene 2001 año
57.185
-2.898
-4.82%
1 ene 2002 año
44.008
-13.177
-23.04%
1 ene 2003 año
38.06
-5.948
-13.52%
1 ene 2004 año
34.85
-3.21
-8.43%
1 ene 2005 año
33.236
-1.614
-4.63%
1 ene 2006 año
30.66
-2.576
-7.75%
1 ene 2007 año
29.413
-1.247
-4.07%
1 ene 2008 año
25.177
-4.237
-14.4%

Ranking de los países por los datos estadísticos actuales