33
/es/
AIzaSyAYiBZKx7MnpbEhh9jyipgxe19OcubqV5w
August 1, 2025
77641
Bahrain
BHR
true
2
1
Stocks traded, turnover ratio of domestic shares (%)
2016,2015,2012,2011,2010,2009,2008,2007,2006,2005,2004,2002,2001,2000,1999,1998,1997
Download
Estadísticas Globales de la Biblioteca →Bahrain →

Stocks traded, turnover ratio of domestic shares (%)

Estas estadísticas en otros países:

Arab WorldArgentinaArmeniaAustraliaAustriaBahrainBangladeshBarbadosBelgiumBermudaBoliviaBotswanaBrazilBulgariaCanadaCaribbean small statesCayman IslandsCentral Europe and the BalticsChannel IslandsChileChinaColombiaCosta RicaCote d'IvoireCroatiaCyprusCzech RepublicDenmarkEarly-demographic dividendEast Asia & PacificEast Asia & Pacific (excluding high income)East Asia & Pacific (IDA & IBRD countries)EcuadorEgypt, Arab Rep.El SalvadorEuro areaEurope & Central AsiaEurope & Central Asia (excluding high income)Europe & Central Asia (IDA & IBRD countries)European UnionFijiFinlandFragile and conflict affected situationsFranceGeorgiaGermanyGhanaGreeceGuyanaHeavily indebted poor countries (HIPC)High incomeHong Kong SAR, ChinaHungaryIBRD onlyIDA & IBRD totalIDA blendIDA onlyIDA totalIndiaIndonesiaIran, Islamic Rep.IrelandIsraelItalyJamaicaJapanJordanKazakhstanKenyaKorea, Rep.KuwaitKyrgyz RepublicLate-demographic dividendLatin America & Caribbean Latin America & Caribbean (excluding high income)Latin America & the Caribbean (IDA & IBRD countries)Least developed countries: UN classificationLebanonLow & middle incomeLow incomeLower middle incomeLuxembourgMacedonia, FYRMalawiMalaysiaMaltaMauritiusMexicoMiddle East & North AfricaMiddle East & North Africa (excluding high income)Middle East & North Africa (IDA & IBRD countries)Middle incomeMoldovaMongoliaMontenegroMoroccoNamibiaNetherlandsNew ZealandNigeriaNorth AmericaNorwayOECD membersOmanOther small statesPacific island small statesPakistanPanamaPapua New GuineaParaguayPeruPhilippinesPolandPortugalPost-demographic dividendPre-demographic dividendQatarRomaniaRussian FederationSaudi ArabiaSerbiaSingaporeSlovak RepublicSloveniaSmall statesSouth AfricaSouth AsiaSouth Asia (IDA & IBRD)SpainSri LankaSt. Kitts and NevisSub-Saharan Africa Sub-Saharan Africa (excluding high income)Sub-Saharan Africa (IDA & IBRD countries)SwazilandSwedenSwitzerlandTanzaniaThailandTrinidad and TobagoTunisiaTurkeyUgandaUkraineUnited Arab EmiratesUnited KingdomUnited StatesUpper middle incomeUruguayUzbekistanVenezuela, RBVietnamWest Bank and GazaWorldZambiaZimbabwe

línea de tiempo (timeline):

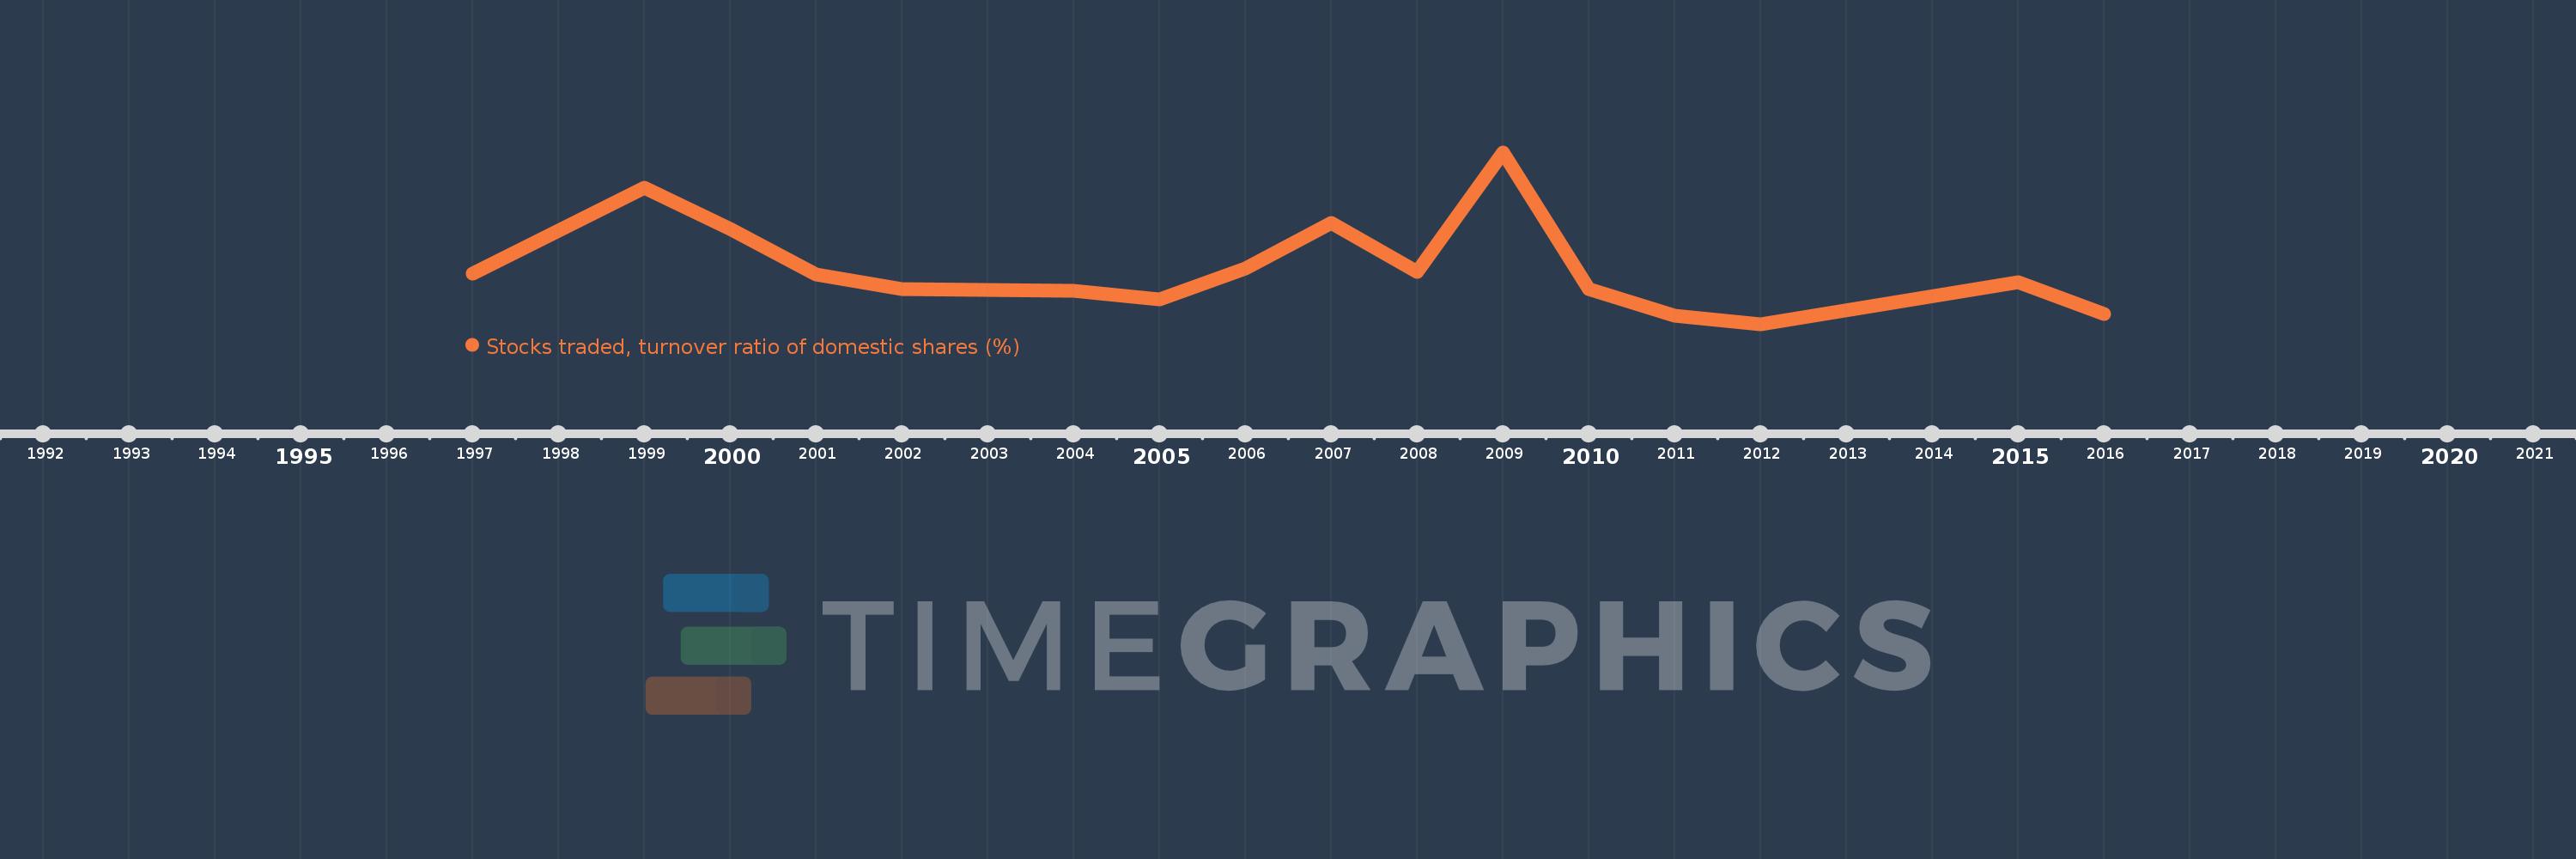
En esta escala de tiempo se presenta un gráfico de 1997 y 2016 de Bahrain. Los datos de 1996 están ausentes. El número de observaciones reales por fecha: 17.

Fuente (nombre):

Indicadores del desarrollo mundial

Fuente (organización):

World Federation of Exchanges database.

Categorías:

Financial Sector

Se ha actualizado:

23 abr 2017 año

Los indicadores de los cambios de valor en los últimos años

En promedio:
4.188
Mínimo:
0.941
1 ene 2012 año
Máximo:
10.446
1 ene 2009 año
A la fecha de observación
Valor
Cambio absoluto
El cambio con respecto al valor anterior
1 ene 1997 año
3.75
+3.75
0.0%
1 ene 1998 año
6.121
+2.371
63.22%
1 ene 1999 año
8.515
+2.393
39.1%
1 ene 2000 año
6.222
-2.293
-26.93%
1 ene 2001 año
3.705
-2.516
-40.45%
1 ene 2002 año
2.902
-0.803
-21.68%
1 ene 2004 año
2.771
-0.131
-4.52%
1 ene 2005 año
2.301
-0.469
-16.94%
1 ene 2006 año
4.044
+1.743
75.73%
1 ene 2007 año
6.539
+2.494
61.67%
1 ene 2008 año
3.857
-2.682
-41.02%
1 ene 2009 año
10.446
+6.589
170.84%
1 ene 2010 año
2.867
-7.578
-72.55%
1 ene 2011 año
1.434
-1.434
-50.0%
1 ene 2012 año
0.941
-0.492
-34.35%
1 ene 2015 año
3.253
+2.312
245.63%
1 ene 2016 año
1.527
-1.725
-53.04%

Ranking de los países por los datos estadísticos actuales