29
/es/
es
AIzaSyAYiBZKx7MnpbEhh9jyipgxe19OcubqV5w
April 1, 2024
153106
Hungary
HUN
true
2
1
Stocks traded, turnover ratio of domestic shares (%)
2016,2015,2014,2013,2012,2011,2010,2009,2008,2007,2006,2005,2004,2003
Download
Estadísticas Globales de la Biblioteca →Hungary →

Stocks traded, turnover ratio of domestic shares (%)

Estas estadísticas en otros países:
Arab WorldArgentinaArmeniaAustraliaAustriaBahrainBangladeshBarbadosBelgiumBermudaBoliviaBotswanaBrazilBulgariaCanadaCaribbean small statesCayman IslandsCentral Europe and the BalticsChannel IslandsChileChinaColombiaCosta RicaCote d'IvoireCroatiaCyprusCzech RepublicDenmarkEarly-demographic dividendEast Asia & PacificEast Asia & Pacific (excluding high income)East Asia & Pacific (IDA & IBRD countries)EcuadorEgypt, Arab Rep.El SalvadorEuro areaEurope & Central AsiaEurope & Central Asia (excluding high income)Europe & Central Asia (IDA & IBRD countries)European UnionFijiFinlandFragile and conflict affected situationsFranceGeorgiaGermanyGhanaGreeceGuyanaHeavily indebted poor countries (HIPC)High incomeHong Kong SAR, ChinaHungaryIBRD onlyIDA & IBRD totalIDA blendIDA onlyIDA totalIndiaIndonesiaIran, Islamic Rep.IrelandIsraelItalyJamaicaJapanJordanKazakhstanKenyaKorea, Rep.KuwaitKyrgyz RepublicLate-demographic dividendLatin America & Caribbean Latin America & Caribbean (excluding high income)Latin America & the Caribbean (IDA & IBRD countries)Least developed countries: UN classificationLebanonLow & middle incomeLow incomeLower middle incomeLuxembourgMacedonia, FYRMalawiMalaysiaMaltaMauritiusMexicoMiddle East & North AfricaMiddle East & North Africa (excluding high income)Middle East & North Africa (IDA & IBRD countries)Middle incomeMoldovaMongoliaMontenegroMoroccoNamibiaNetherlandsNew ZealandNigeriaNorth AmericaNorwayOECD membersOmanOther small statesPacific island small statesPakistanPanamaPapua New GuineaParaguayPeruPhilippinesPolandPortugalPost-demographic dividendPre-demographic dividendQatarRomaniaRussian FederationSaudi ArabiaSerbiaSingaporeSlovak RepublicSloveniaSmall statesSouth AfricaSouth AsiaSouth Asia (IDA & IBRD)SpainSri LankaSt. Kitts and NevisSub-Saharan Africa Sub-Saharan Africa (excluding high income)Sub-Saharan Africa (IDA & IBRD countries)SwazilandSwedenSwitzerlandTanzaniaThailandTrinidad and TobagoTunisiaTurkeyUgandaUkraineUnited Arab EmiratesUnited KingdomUnited StatesUpper middle incomeUruguayUzbekistanVenezuela, RBVietnamWest Bank and GazaWorldZambiaZimbabwe
línea de tiempo (timeline):
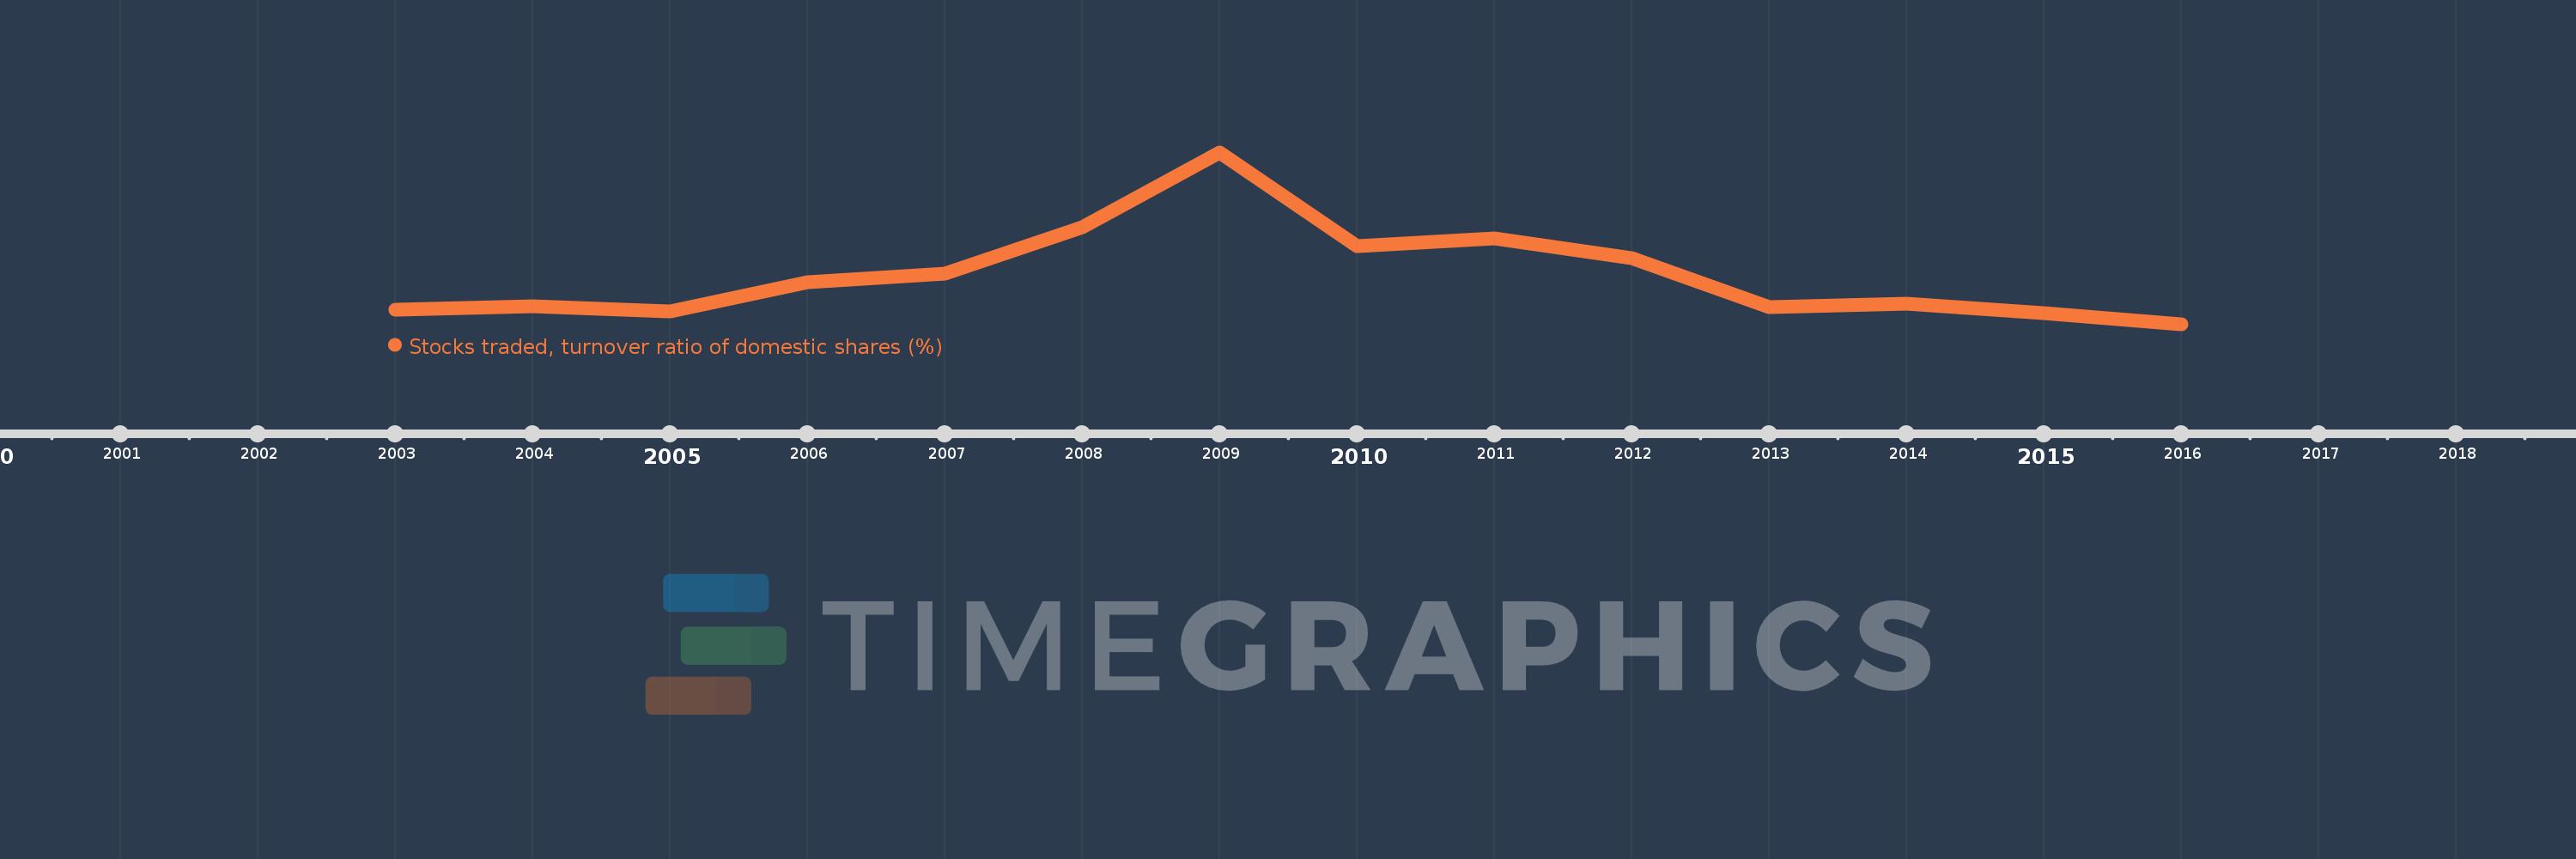
En esta escala de tiempo se presenta un gráfico de 2003 y 2016 de Hungary. Los datos de 2002 están ausentes. El número de observaciones reales por fecha: 14.
Fuente (nombre):
Indicadores del desarrollo mundial
Fuente (organización):
World Federation of Exchanges database.
Categorías:
Financial Sector
Se ha actualizado:
23 abr 2017 año
Los indicadores de los cambios de valor en los últimos años
En promedio:
72.558
Mínimo:
42.068
1 ene 2016 año
Máximo:
149.272
1 ene 2009 año
A la fecha de observación
Valor
Cambio absoluto
El cambio con respecto al valor anterior
1 ene 2003 año
51.138
+51.138
0.0%
1 ene 2004 año
53.188
+2.05
4.01%
1 ene 2005 año
49.897
-3.29
-6.19%
1 ene 2006 año
68.039
+18.141
36.36%
1 ene 2007 año
73.893
+5.854
8.6%
1 ene 2008 año
102.361
+28.468
38.53%
1 ene 2009 año
149.272
+46.911
45.83%
1 ene 2010 año
90.576
-58.697
-39.32%
1 ene 2011 año
95.518
+4.942
5.46%
1 ene 2012 año
83.375
-12.143
-12.71%
1 ene 2013 año
52.81
-30.565
-36.66%
1 ene 2014 año
54.667
+1.857
3.52%
1 ene 2015 año
49.015
-5.652
-10.34%
1 ene 2016 año
42.068
-6.947
-14.17%
Ranking de los países por los datos estadísticos actuales

Comentarios:

Enviar
PremiumAbout & FeedbackAcuerdoPrivacidad
logo
© 2022 Selected Technologies LLC – Morgan Hill, California