33
/es/
AIzaSyAYiBZKx7MnpbEhh9jyipgxe19OcubqV5w
May 1, 2025
114323
Cote d'Ivoire
CIV
true
2
1
Stocks traded, turnover ratio of domestic shares (%)
2016,2015,2014,2012,2011,2010,2009,2008,2007,2006,2005,2004,2003,2002,2001,2000,1999,1997,1996,1995,1994
Download
Estadísticas Globales de la Biblioteca →Cote d'Ivoire →

Stocks traded, turnover ratio of domestic shares (%)

Estas estadísticas en otros países:

Arab WorldArgentinaArmeniaAustraliaAustriaBahrainBangladeshBarbadosBelgiumBermudaBoliviaBotswanaBrazilBulgariaCanadaCaribbean small statesCayman IslandsCentral Europe and the BalticsChannel IslandsChileChinaColombiaCosta RicaCote d'IvoireCroatiaCyprusCzech RepublicDenmarkEarly-demographic dividendEast Asia & PacificEast Asia & Pacific (excluding high income)East Asia & Pacific (IDA & IBRD countries)EcuadorEgypt, Arab Rep.El SalvadorEuro areaEurope & Central AsiaEurope & Central Asia (excluding high income)Europe & Central Asia (IDA & IBRD countries)European UnionFijiFinlandFragile and conflict affected situationsFranceGeorgiaGermanyGhanaGreeceGuyanaHeavily indebted poor countries (HIPC)High incomeHong Kong SAR, ChinaHungaryIBRD onlyIDA & IBRD totalIDA blendIDA onlyIDA totalIndiaIndonesiaIran, Islamic Rep.IrelandIsraelItalyJamaicaJapanJordanKazakhstanKenyaKorea, Rep.KuwaitKyrgyz RepublicLate-demographic dividendLatin America & Caribbean Latin America & Caribbean (excluding high income)Latin America & the Caribbean (IDA & IBRD countries)Least developed countries: UN classificationLebanonLow & middle incomeLow incomeLower middle incomeLuxembourgMacedonia, FYRMalawiMalaysiaMaltaMauritiusMexicoMiddle East & North AfricaMiddle East & North Africa (excluding high income)Middle East & North Africa (IDA & IBRD countries)Middle incomeMoldovaMongoliaMontenegroMoroccoNamibiaNetherlandsNew ZealandNigeriaNorth AmericaNorwayOECD membersOmanOther small statesPacific island small statesPakistanPanamaPapua New GuineaParaguayPeruPhilippinesPolandPortugalPost-demographic dividendPre-demographic dividendQatarRomaniaRussian FederationSaudi ArabiaSerbiaSingaporeSlovak RepublicSloveniaSmall statesSouth AfricaSouth AsiaSouth Asia (IDA & IBRD)SpainSri LankaSt. Kitts and NevisSub-Saharan Africa Sub-Saharan Africa (excluding high income)Sub-Saharan Africa (IDA & IBRD countries)SwazilandSwedenSwitzerlandTanzaniaThailandTrinidad and TobagoTunisiaTurkeyUgandaUkraineUnited Arab EmiratesUnited KingdomUnited StatesUpper middle incomeUruguayUzbekistanVenezuela, RBVietnamWest Bank and GazaWorldZambiaZimbabwe

línea de tiempo (timeline):

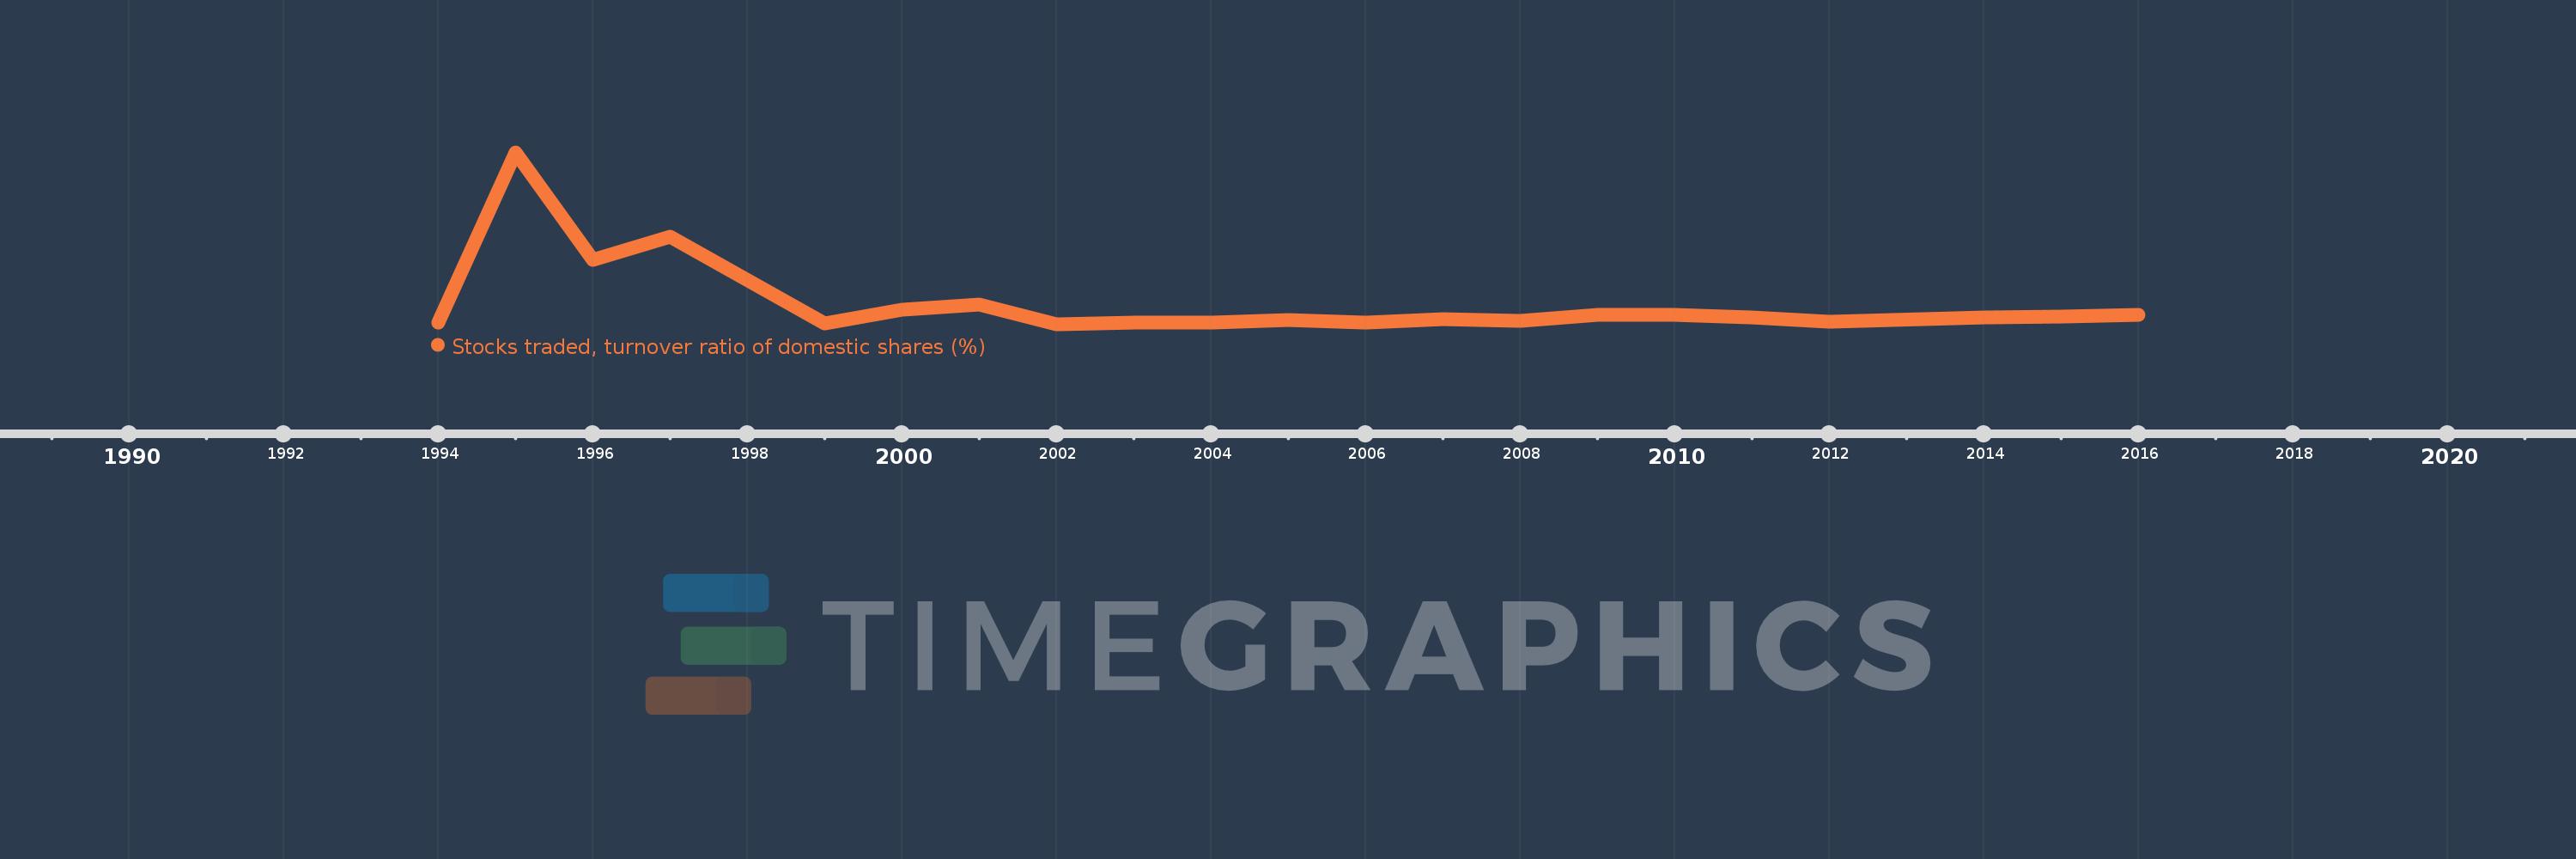
En esta escala de tiempo se presenta un gráfico de 1994 y 2016 de Cote d'Ivoire. Los datos de 1993 están ausentes. El número de observaciones reales por fecha: 21.

Fuente (nombre):

Indicadores del desarrollo mundial

Fuente (organización):

World Federation of Exchanges database.

Categorías:

Financial Sector

Se ha actualizado:

23 abr 2017 año

Los indicadores de los cambios de valor en los últimos años

En promedio:
7.805
Mínimo:
0.874
1 ene 2002 año
Máximo:
58.884
1 ene 1995 año
A la fecha de observación
Valor
Cambio absoluto
El cambio con respecto al valor anterior
1 ene 1994 año
1.565
+1.565
0.0%
1 ene 1995 año
58.884
+57.319
3.66 mil%
1 ene 1996 año
22.564
-36.32
-61.68%
1 ene 1997 año
30.552
+7.989
35.41%
1 ene 1999 año
1.042
-29.51
-96.59%
1 ene 2000 año
5.831
+4.789
459.58%
1 ene 2001 año
7.561
+1.73
29.66%
1 ene 2002 año
0.874
-6.687
-88.44%
1 ene 2003 año
1.33
+0.457
52.25%
1 ene 2004 año
1.473
+0.143
10.74%
1 ene 2005 año
2.409
+0.936
63.51%
1 ene 2006 año
1.499
-0.91
-37.78%
1 ene 2007 año
2.576
+1.077
71.86%
1 ene 2008 año
1.979
-0.597
-23.18%
1 ene 2009 año
4.118
+2.139
108.07%
1 ene 2010 año
3.929
-0.189
-4.59%
1 ene 2011 año
3.171
-0.757
-19.27%
1 ene 2012 año
1.854
-1.317
-41.54%
1 ene 2014 año
3.108
+1.254
67.64%
1 ene 2015 año
3.407
+0.299
9.61%
1 ene 2016 año
4.177
+0.77
22.6%

Ranking de los países por los datos estadísticos actuales