33
/es/
AIzaSyAYiBZKx7MnpbEhh9jyipgxe19OcubqV5w
August 1, 2025
191928
Malta
MLT
true
2
1
Stocks traded, turnover ratio of domestic shares (%)
2016,2015,2014,2013,2012,2011,2010,2009,2008,2007,2006,2005,2004,2003,2002,2001
Download
Estadísticas Globales de la Biblioteca →Malta →

Stocks traded, turnover ratio of domestic shares (%)

Estas estadísticas en otros países:

Arab WorldArgentinaArmeniaAustraliaAustriaBahrainBangladeshBarbadosBelgiumBermudaBoliviaBotswanaBrazilBulgariaCanadaCaribbean small statesCayman IslandsCentral Europe and the BalticsChannel IslandsChileChinaColombiaCosta RicaCote d'IvoireCroatiaCyprusCzech RepublicDenmarkEarly-demographic dividendEast Asia & PacificEast Asia & Pacific (excluding high income)East Asia & Pacific (IDA & IBRD countries)EcuadorEgypt, Arab Rep.El SalvadorEuro areaEurope & Central AsiaEurope & Central Asia (excluding high income)Europe & Central Asia (IDA & IBRD countries)European UnionFijiFinlandFragile and conflict affected situationsFranceGeorgiaGermanyGhanaGreeceGuyanaHeavily indebted poor countries (HIPC)High incomeHong Kong SAR, ChinaHungaryIBRD onlyIDA & IBRD totalIDA blendIDA onlyIDA totalIndiaIndonesiaIran, Islamic Rep.IrelandIsraelItalyJamaicaJapanJordanKazakhstanKenyaKorea, Rep.KuwaitKyrgyz RepublicLate-demographic dividendLatin America & Caribbean Latin America & Caribbean (excluding high income)Latin America & the Caribbean (IDA & IBRD countries)Least developed countries: UN classificationLebanonLow & middle incomeLow incomeLower middle incomeLuxembourgMacedonia, FYRMalawiMalaysiaMaltaMauritiusMexicoMiddle East & North AfricaMiddle East & North Africa (excluding high income)Middle East & North Africa (IDA & IBRD countries)Middle incomeMoldovaMongoliaMontenegroMoroccoNamibiaNetherlandsNew ZealandNigeriaNorth AmericaNorwayOECD membersOmanOther small statesPacific island small statesPakistanPanamaPapua New GuineaParaguayPeruPhilippinesPolandPortugalPost-demographic dividendPre-demographic dividendQatarRomaniaRussian FederationSaudi ArabiaSerbiaSingaporeSlovak RepublicSloveniaSmall statesSouth AfricaSouth AsiaSouth Asia (IDA & IBRD)SpainSri LankaSt. Kitts and NevisSub-Saharan Africa Sub-Saharan Africa (excluding high income)Sub-Saharan Africa (IDA & IBRD countries)SwazilandSwedenSwitzerlandTanzaniaThailandTrinidad and TobagoTunisiaTurkeyUgandaUkraineUnited Arab EmiratesUnited KingdomUnited StatesUpper middle incomeUruguayUzbekistanVenezuela, RBVietnamWest Bank and GazaWorldZambiaZimbabwe

línea de tiempo (timeline):

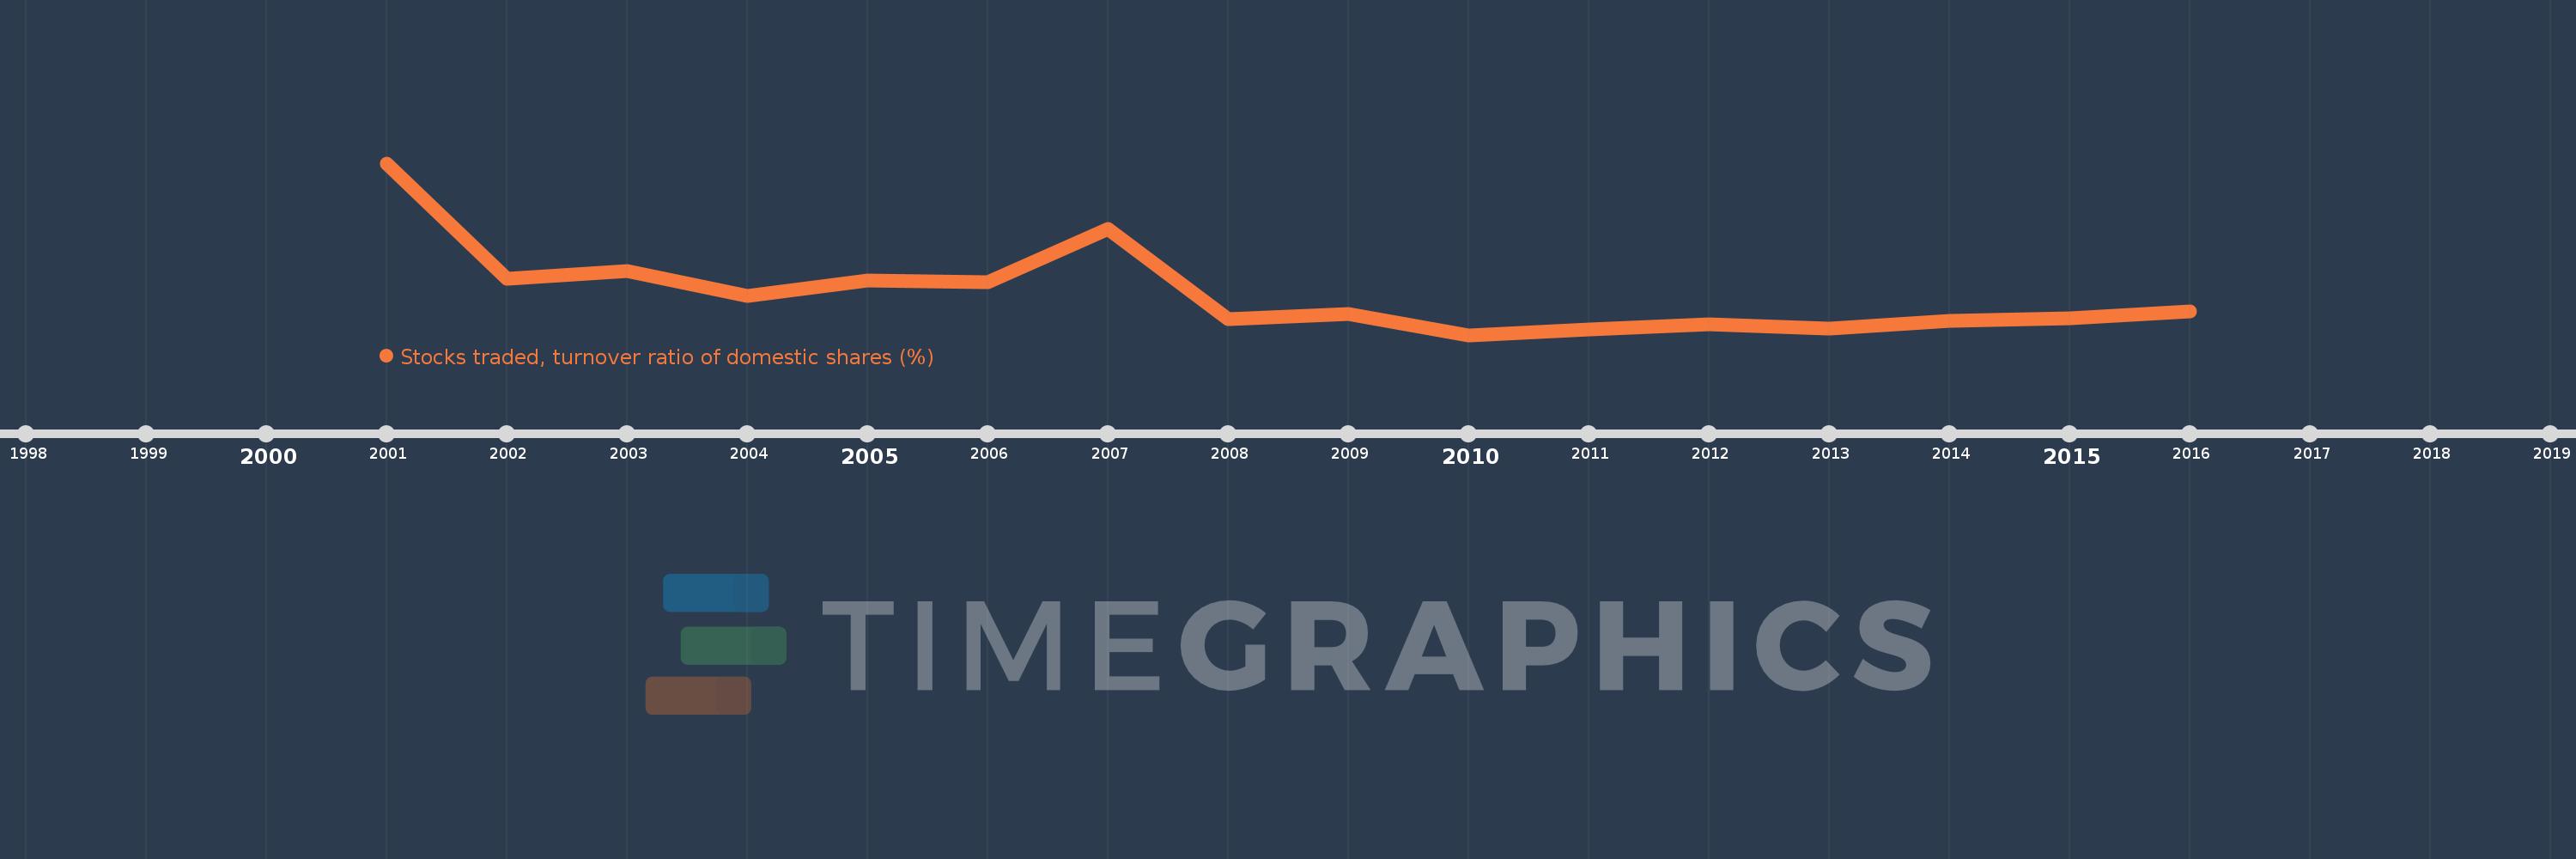
En esta escala de tiempo se presenta un gráfico de 2001 y 2016 de Malta. Los datos de 2000 están ausentes. El número de observaciones reales por fecha: 16.

Fuente (nombre):

Indicadores del desarrollo mundial

Fuente (organización):

World Federation of Exchanges database.

Categorías:

Financial Sector

Se ha actualizado:

23 abr 2017 año

Los indicadores de los cambios de valor en los últimos años

En promedio:
2.88
Mínimo:
0.894
1 ene 2010 año
Máximo:
9.184
1 ene 2001 año
A la fecha de observación
Valor
Cambio absoluto
El cambio con respecto al valor anterior
1 ene 2001 año
9.184
+9.184
0.0%
1 ene 2002 año
3.601
-5.583
-60.79%
1 ene 2003 año
3.993
+0.392
10.88%
1 ene 2004 año
2.762
-1.231
-30.82%
1 ene 2005 año
3.545
+0.782
28.33%
1 ene 2006 año
3.425
-0.12
-3.38%
1 ene 2007 año
6.007
+2.582
75.39%
1 ene 2008 año
1.679
-4.328
-72.05%
1 ene 2009 año
1.904
+0.225
13.39%
1 ene 2010 año
0.894
-1.01
-53.05%
1 ene 2011 año
1.158
+0.264
29.56%
1 ene 2012 año
1.422
+0.264
22.83%
1 ene 2013 año
1.214
-0.208
-14.64%
1 ene 2014 año
1.585
+0.371
30.57%
1 ene 2015 año
1.688
+0.102
6.46%
1 ene 2016 año
2.016
+0.328
19.44%

Ranking de los países por los datos estadísticos actuales