29
/es/
es
AIzaSyAYiBZKx7MnpbEhh9jyipgxe19OcubqV5w
April 1, 2024
31148
Europe & Central Asia
ECS
false
2
1
Social contributions (% of revenue)
2015,2014,2013,2012,2011,2010,2009,2008,2007,2006,2005,2004,2003,2002,2001,2000,1999,1998,1997,1996,1995
Download
Estadísticas Globales de la Biblioteca →Europe & Central Asia →

Social contributions (% of revenue)

Estas estadísticas en otros países:
AfghanistanAlbaniaAngolaArgentinaArmeniaAustraliaAustriaAzerbaijanBarbadosBelarusBelgiumBelizeBeninBhutanBoliviaBosnia and HerzegovinaBrazilBulgariaBurundiCabo VerdeCanadaCaribbean small statesCentral African RepublicCentral Europe and the BalticsChileChinaColombiaCongo, Rep.Costa RicaCote d'IvoireCroatiaCyprusCzech RepublicDenmarkDominican RepublicEgypt, Arab Rep.El SalvadorEstoniaEthiopiaEuro areaEurope & Central AsiaEurope & Central Asia (excluding high income)Europe & Central Asia (IDA & IBRD countries)European UnionFijiFinlandFranceGambia, TheGeorgiaGermanyGhanaGreeceGuatemalaHigh incomeHondurasHong Kong SAR, ChinaHungaryIBRD onlyIcelandIDA blendIndiaIndonesiaIran, Islamic Rep.IraqIrelandIsraelItalyJamaicaJapanJordanKazakhstanKenyaKorea, Rep.Late-demographic dividendLatin America & Caribbean Latin America & Caribbean (excluding high income)Latin America & the Caribbean (IDA & IBRD countries)LatviaLebanonLiberiaLithuaniaLuxembourgMacao SAR, ChinaMacedonia, FYRMadagascarMaltaMauritiusMexicoMoldovaMongoliaMoroccoMozambiqueNamibiaNetherlandsNew ZealandNorth AmericaNorwayOECD membersPanamaPapua New GuineaParaguayPeruPolandPortugalPost-demographic dividendRomaniaRussian FederationSan MarinoSao Tome and PrincipeSerbiaSeychellesSlovak RepublicSloveniaSmall statesSouth AfricaSouth AsiaSouth Asia (IDA & IBRD)SpainSri LankaSt. Kitts and NevisSwedenSwitzerlandSyrian Arab RepublicTajikistanThailandTrinidad and TobagoTunisiaTurkeyUkraineUnited Arab EmiratesUnited KingdomUnited StatesUpper middle incomeUruguayVenezuela, RBZambiaZimbabwe
línea de tiempo (timeline):
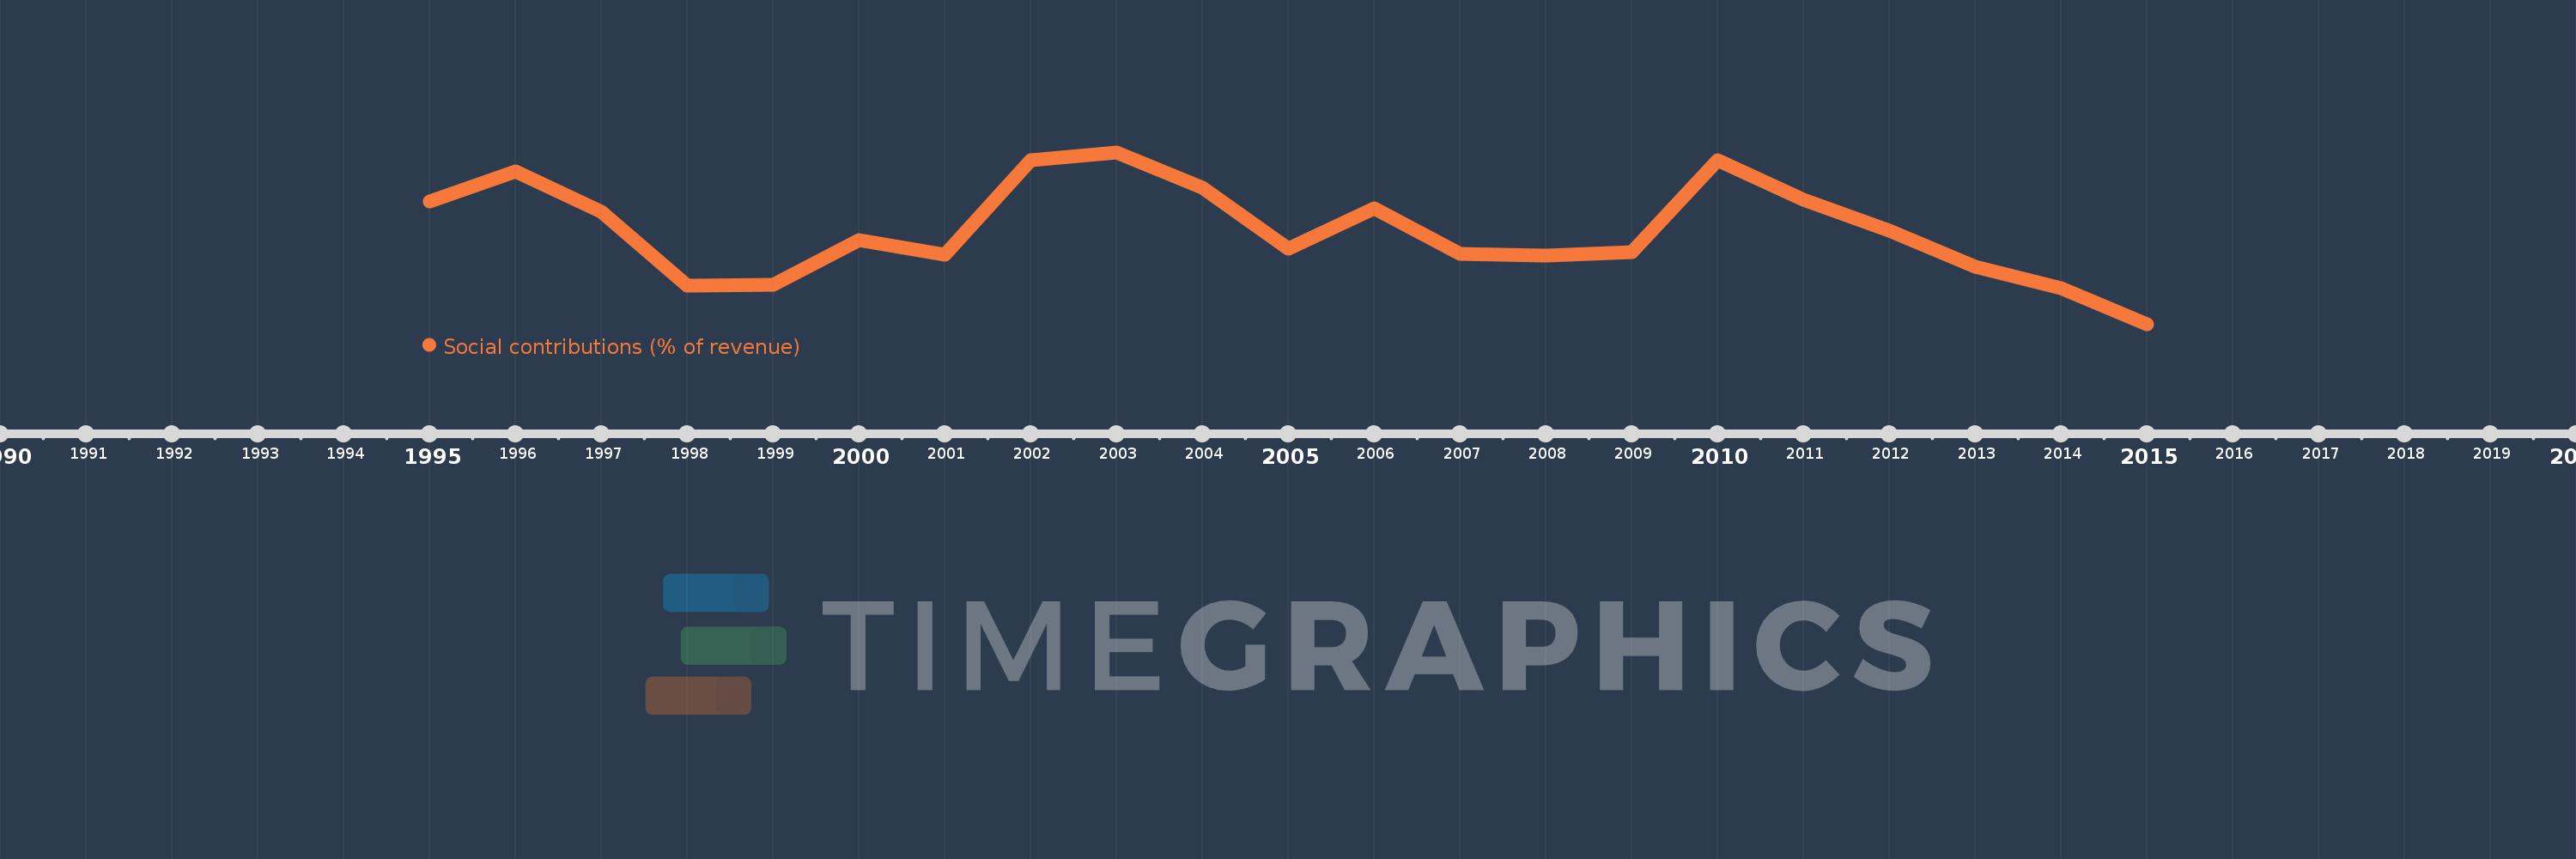
En esta escala de tiempo se presenta un gráfico de 1995 y 2015 de Europe & Central Asia. Los datos de 1994 están ausentes. El número de observaciones reales por fecha: 21.
Fuente (nombre):
Indicadores del desarrollo mundial
Fuente (organización):
International Monetary Fund, Government Finance Statistics Yearbook and data files.
Categorías:
Public Sector
Se ha actualizado:
23 abr 2017 año
Los indicadores de los cambios de valor en los últimos años
En promedio:
31.79
Mínimo:
29.819
1 ene 2015 año
Máximo:
33.428
1 ene 2003 año
A la fecha de observación
Valor
Cambio absoluto
El cambio con respecto al valor anterior
1 ene 1995 año
32.406
+32.406
0.0%
1 ene 1996 año
33.034
+0.628
1.94%
1 ene 1997 año
32.181
-0.853
-2.58%
1 ene 1998 año
30.637
-1.544
-4.8%
1 ene 1999 año
30.647
+0.009
0.03%
1 ene 2000 año
31.589
+0.943
3.08%
1 ene 2001 año
31.278
-0.312
-0.99%
1 ene 2002 año
33.257
+1.979
6.33%
1 ene 2003 año
33.428
+0.171
0.52%
1 ene 2004 año
32.695
-0.734
-2.2%
1 ene 2005 año
31.399
-1.295
-3.96%
1 ene 2006 año
32.25
+0.85
2.71%
1 ene 2007 año
31.304
-0.946
-2.93%
1 ene 2008 año
31.258
-0.046
-0.15%
1 ene 2009 año
31.34
+0.082
0.26%
1 ene 2010 año
33.257
+1.917
6.12%
1 ene 2011 año
32.441
-0.815
-2.45%
1 ene 2012 año
31.777
-0.665
-2.05%
1 ene 2013 año
31.032
-0.744
-2.34%
1 ene 2014 año
30.567
-0.465
-1.5%
1 ene 2015 año
29.819
-0.748
-2.45%
Ranking de los países por los datos estadísticos actuales

Comentarios:

Enviar
PremiumAbout & FeedbackAcuerdoPrivacidad
logo
© 2022 Selected Technologies LLC – Morgan Hill, California