29
/es/
es
AIzaSyAYiBZKx7MnpbEhh9jyipgxe19OcubqV5w
April 1, 2024
181640
Lithuania
LTU
true
2
1
Social contributions (% of revenue)
2015,2014,2013,2012,2011,2010,2009,2008,2007,2006,2005,2004,2003,2001,2000,1999,1998,1996,1995,1994,1992
Download
Estadísticas Globales de la Biblioteca →Lithuania →

Social contributions (% of revenue)

Estas estadísticas en otros países:
AfghanistanAlbaniaAngolaArgentinaArmeniaAustraliaAustriaAzerbaijanBarbadosBelarusBelgiumBelizeBeninBhutanBoliviaBosnia and HerzegovinaBrazilBulgariaBurundiCabo VerdeCanadaCaribbean small statesCentral African RepublicCentral Europe and the BalticsChileChinaColombiaCongo, Rep.Costa RicaCote d'IvoireCroatiaCyprusCzech RepublicDenmarkDominican RepublicEgypt, Arab Rep.El SalvadorEstoniaEthiopiaEuro areaEurope & Central AsiaEurope & Central Asia (excluding high income)Europe & Central Asia (IDA & IBRD countries)European UnionFijiFinlandFranceGambia, TheGeorgiaGermanyGhanaGreeceGuatemalaHigh incomeHondurasHong Kong SAR, ChinaHungaryIBRD onlyIcelandIDA blendIndiaIndonesiaIran, Islamic Rep.IraqIrelandIsraelItalyJamaicaJapanJordanKazakhstanKenyaKorea, Rep.Late-demographic dividendLatin America & Caribbean Latin America & Caribbean (excluding high income)Latin America & the Caribbean (IDA & IBRD countries)LatviaLebanonLiberiaLithuaniaLuxembourgMacao SAR, ChinaMacedonia, FYRMadagascarMaltaMauritiusMexicoMoldovaMongoliaMoroccoMozambiqueNamibiaNetherlandsNew ZealandNorth AmericaNorwayOECD membersPanamaPapua New GuineaParaguayPeruPolandPortugalPost-demographic dividendRomaniaRussian FederationSan MarinoSao Tome and PrincipeSerbiaSeychellesSlovak RepublicSloveniaSmall statesSouth AfricaSouth AsiaSouth Asia (IDA & IBRD)SpainSri LankaSt. Kitts and NevisSwedenSwitzerlandSyrian Arab RepublicTajikistanThailandTrinidad and TobagoTunisiaTurkeyUkraineUnited Arab EmiratesUnited KingdomUnited StatesUpper middle incomeUruguayVenezuela, RBZambiaZimbabwe
línea de tiempo (timeline):
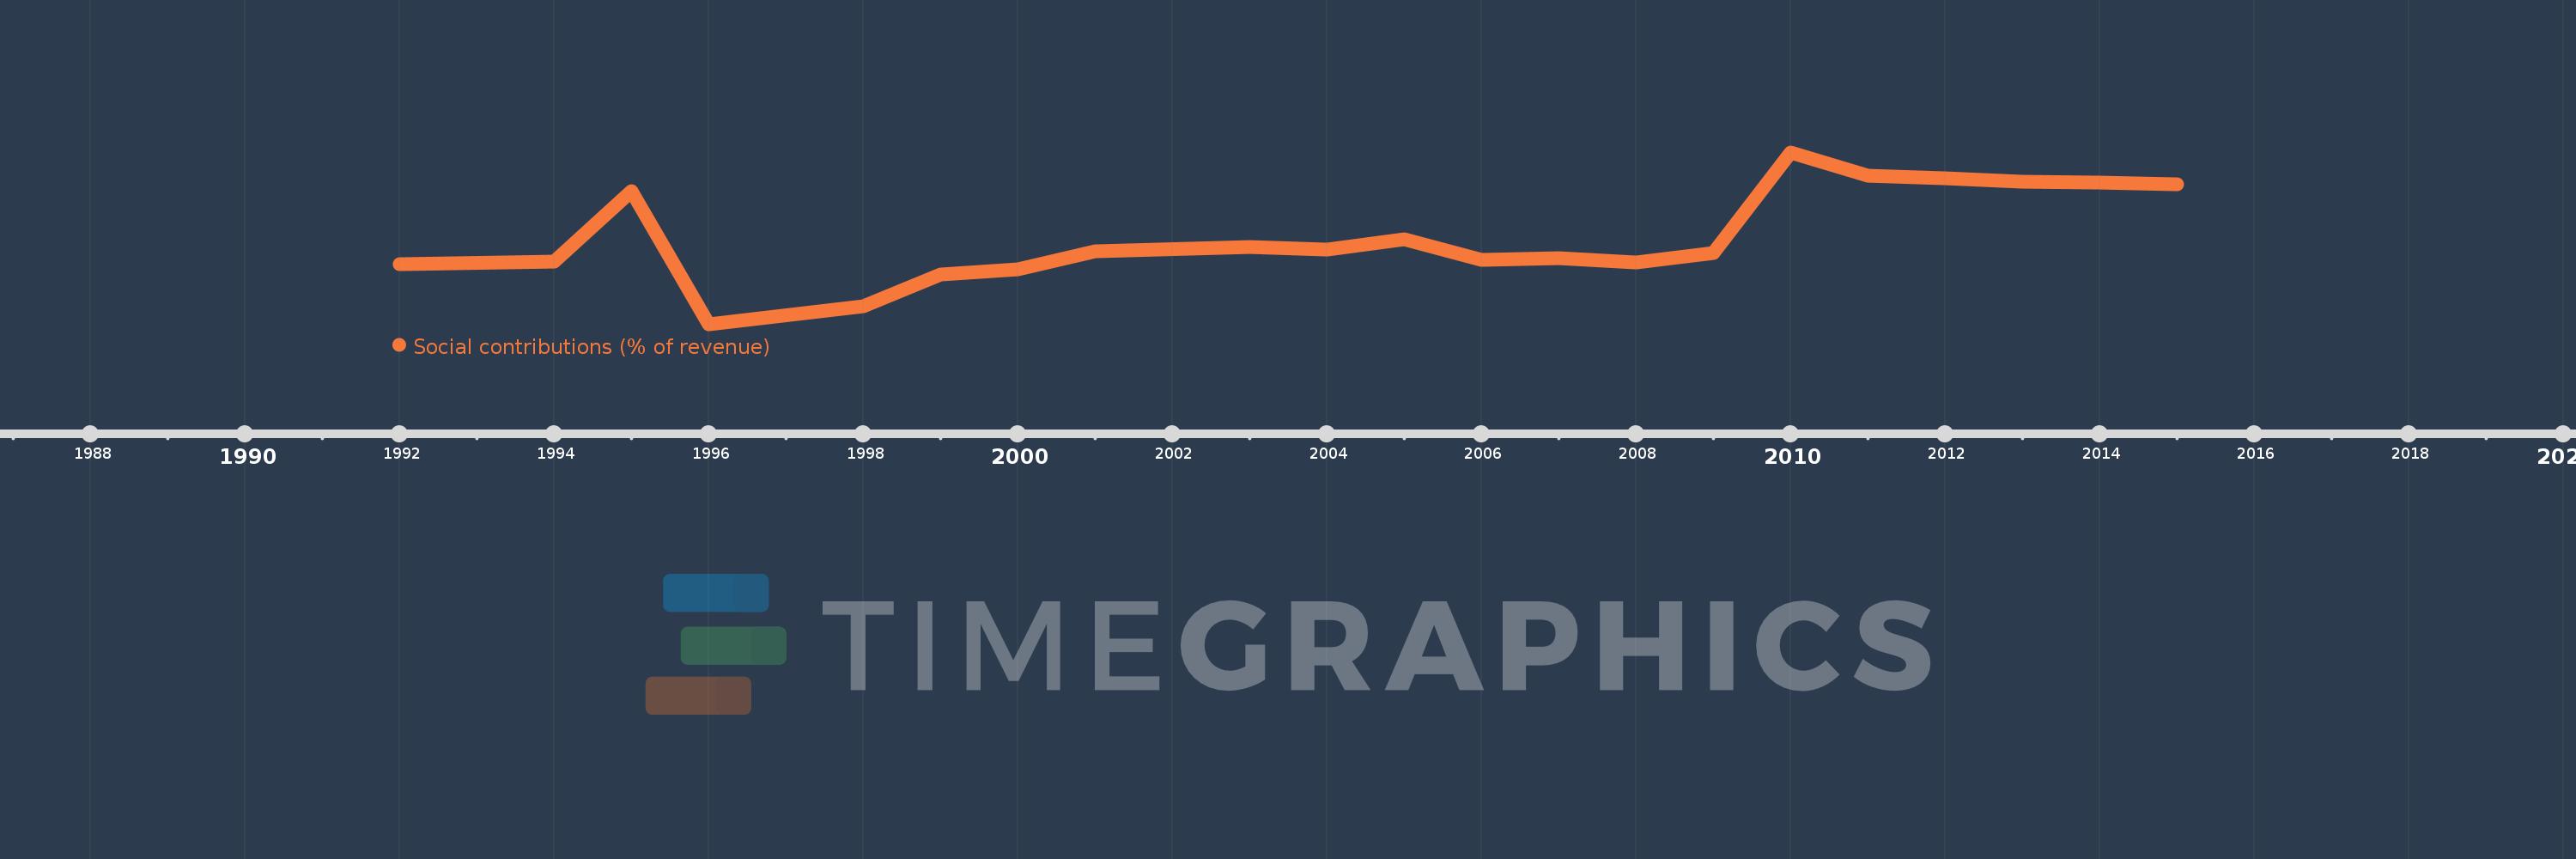
En esta escala de tiempo se presenta un gráfico de 1992 y 2015 de Lithuania. Los datos de 1991 están ausentes. El número de observaciones reales por fecha: 21.
Fuente (nombre):
Indicadores del desarrollo mundial
Fuente (organización):
International Monetary Fund, Government Finance Statistics Yearbook and data files.
Categorías:
Public Sector
Se ha actualizado:
23 abr 2017 año
Los indicadores de los cambios de valor en los últimos años
En promedio:
29.687
Mínimo:
22.069
1 ene 1996 año
Máximo:
36.996
1 ene 2010 año
A la fecha de observación
Valor
Cambio absoluto
El cambio con respecto al valor anterior
1 ene 1992 año
27.319
+27.319
0.0%
1 ene 1994 año
27.49
+0.171
0.63%
1 ene 1995 año
33.593
+6.103
22.2%
1 ene 1996 año
22.069
-11.524
-34.31%
1 ene 1998 año
23.595
+1.526
6.92%
1 ene 1999 año
26.414
+2.818
11.94%
1 ene 2000 año
26.862
+0.448
1.7%
1 ene 2001 año
28.386
+1.525
5.68%
1 ene 2003 año
28.77
+0.384
1.35%
1 ene 2004 año
28.567
-0.204
-0.71%
1 ene 2005 año
29.427
+0.86
3.01%
1 ene 2006 año
27.655
-1.772
-6.02%
1 ene 2007 año
27.82
+0.165
0.6%
1 ene 2008 año
27.446
-0.374
-1.34%
1 ene 2009 año
28.285
+0.839
3.06%
1 ene 2010 año
36.996
+8.711
30.8%
1 ene 2011 año
34.983
-2.013
-5.44%
1 ene 2012 año
34.739
-0.244
-0.7%
1 ene 2013 año
34.429
-0.31
-0.89%
1 ene 2014 año
34.379
-0.05
-0.15%
1 ene 2015 año
34.2
-0.178
-0.52%
Ranking de los países por los datos estadísticos actuales

Comentarios:

Enviar
PremiumAbout & FeedbackAcuerdoPrivacidad
logo
© 2022 Selected Technologies LLC – Morgan Hill, California