29
/es/
es
AIzaSyAYiBZKx7MnpbEhh9jyipgxe19OcubqV5w
April 1, 2024
249475
Sri Lanka
LKA
true
2
1
Social contributions (% of revenue)
2015,2014,2013,2012,2011,2010,2009,2008,2007,2006,2005,2004,2003,2002,2001,2000,1999,1998,1997,1996,1995,1994,1993,1992,1991
Download
Estadísticas Globales de la Biblioteca →Sri Lanka →

Social contributions (% of revenue)

Estas estadísticas en otros países:
AfghanistanAlbaniaAngolaArgentinaArmeniaAustraliaAustriaAzerbaijanBarbadosBelarusBelgiumBelizeBeninBhutanBoliviaBosnia and HerzegovinaBrazilBulgariaBurundiCabo VerdeCanadaCaribbean small statesCentral African RepublicCentral Europe and the BalticsChileChinaColombiaCongo, Rep.Costa RicaCote d'IvoireCroatiaCyprusCzech RepublicDenmarkDominican RepublicEgypt, Arab Rep.El SalvadorEstoniaEthiopiaEuro areaEurope & Central AsiaEurope & Central Asia (excluding high income)Europe & Central Asia (IDA & IBRD countries)European UnionFijiFinlandFranceGambia, TheGeorgiaGermanyGhanaGreeceGuatemalaHigh incomeHondurasHong Kong SAR, ChinaHungaryIBRD onlyIcelandIDA blendIndiaIndonesiaIran, Islamic Rep.IraqIrelandIsraelItalyJamaicaJapanJordanKazakhstanKenyaKorea, Rep.Late-demographic dividendLatin America & Caribbean Latin America & Caribbean (excluding high income)Latin America & the Caribbean (IDA & IBRD countries)LatviaLebanonLiberiaLithuaniaLuxembourgMacao SAR, ChinaMacedonia, FYRMadagascarMaltaMauritiusMexicoMoldovaMongoliaMoroccoMozambiqueNamibiaNetherlandsNew ZealandNorth AmericaNorwayOECD membersPanamaPapua New GuineaParaguayPeruPolandPortugalPost-demographic dividendRomaniaRussian FederationSan MarinoSao Tome and PrincipeSerbiaSeychellesSlovak RepublicSloveniaSmall statesSouth AfricaSouth AsiaSouth Asia (IDA & IBRD)SpainSri LankaSt. Kitts and NevisSwedenSwitzerlandSyrian Arab RepublicTajikistanThailandTrinidad and TobagoTunisiaTurkeyUkraineUnited Arab EmiratesUnited KingdomUnited StatesUpper middle incomeUruguayVenezuela, RBZambiaZimbabwe
línea de tiempo (timeline):
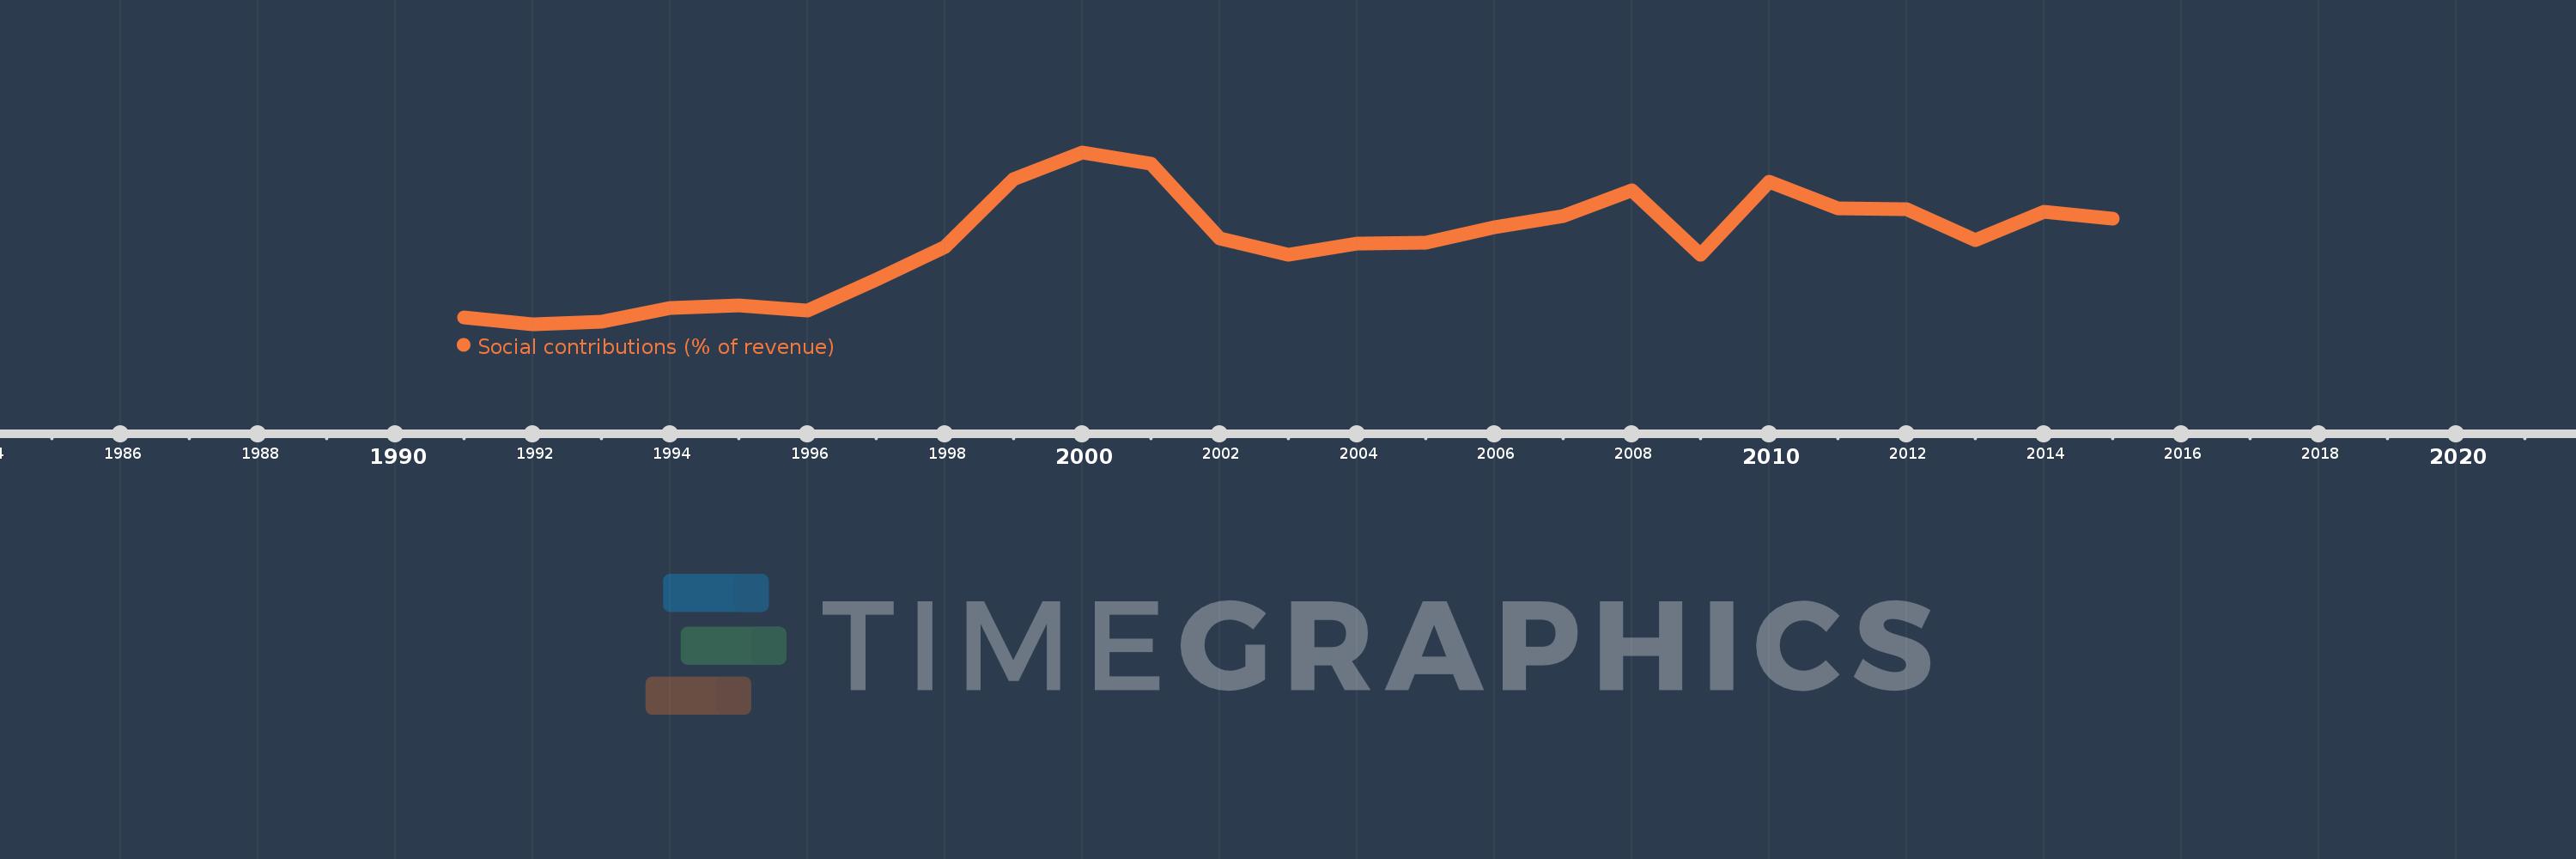
En esta escala de tiempo se presenta un gráfico de 1991 y 2015 de Sri Lanka. Los datos de 1990 están ausentes. El número de observaciones reales por fecha: 25.
Fuente (nombre):
Indicadores del desarrollo mundial
Fuente (organización):
International Monetary Fund, Government Finance Statistics Yearbook and data files.
Categorías:
Public Sector
Se ha actualizado:
23 abr 2017 año
Los indicadores de los cambios de valor en los últimos años
En promedio:
1.084
Mínimo:
0.464
1 ene 1992 año
Máximo:
1.757
1 ene 2000 año
A la fecha de observación
Valor
Cambio absoluto
El cambio con respecto al valor anterior
1 ene 1991 año
0.513
+0.513
0.0%
1 ene 1992 año
0.464
-0.049
-9.51%
1 ene 1993 año
0.482
+0.018
3.84%
1 ene 1994 año
0.587
+0.105
21.9%
1 ene 1995 año
0.608
+0.021
3.52%
1 ene 1996 año
0.568
-0.04
-6.51%
1 ene 1997 año
0.8
+0.232
40.8%
1 ene 1998 año
1.044
+0.244
30.5%
1 ene 1999 año
1.557
+0.513
49.16%
1 ene 2000 año
1.757
+0.2
12.83%
1 ene 2001 año
1.673
-0.084
-4.79%
1 ene 2002 año
1.113
-0.56
-33.49%
1 ene 2003 año
0.985
-0.128
-11.47%
1 ene 2004 año
1.069
+0.084
8.48%
1 ene 2005 año
1.076
+0.008
0.71%
1 ene 2006 año
1.191
+0.115
10.67%
1 ene 2007 año
1.276
+0.086
7.18%
1 ene 2008 año
1.475
+0.199
15.57%
1 ene 2009 año
0.989
-0.486
-32.94%
1 ene 2010 año
1.539
+0.55
55.55%
1 ene 2011 año
1.333
-0.206
-13.37%
1 ene 2012 año
1.329
-0.004
-0.27%
1 ene 2013 año
1.1
-0.229
-17.22%
1 ene 2014 año
1.313
+0.213
19.34%
1 ene 2015 año
1.257
-0.056
-4.29%
Ranking de los países por los datos estadísticos actuales

Comentarios:

Enviar
PremiumAbout & FeedbackAcuerdoPrivacidad
logo
© 2022 Selected Technologies LLC – Morgan Hill, California