30
/es/
AIzaSyAYiBZKx7MnpbEhh9jyipgxe19OcubqV5w
April 1, 2024
267415
Trinidad and Tobago
TTO
true
2
1
Social contributions (% of revenue)
2013,2012,2011,2010,2009,2008,2007,2006,2005,2004,2003,2002,1996,1995,1994,1982,1981,1980,1979,1978,1977
Download
Estadísticas Globales de la Biblioteca →Trinidad and Tobago →

Social contributions (% of revenue)

Estas estadísticas en otros países:

AfghanistanAlbaniaAngolaArgentinaArmeniaAustraliaAustriaAzerbaijanBarbadosBelarusBelgiumBelizeBeninBhutanBoliviaBosnia and HerzegovinaBrazilBulgariaBurundiCabo VerdeCanadaCaribbean small statesCentral African RepublicCentral Europe and the BalticsChileChinaColombiaCongo, Rep.Costa RicaCote d'IvoireCroatiaCyprusCzech RepublicDenmarkDominican RepublicEgypt, Arab Rep.El SalvadorEstoniaEthiopiaEuro areaEurope & Central AsiaEurope & Central Asia (excluding high income)Europe & Central Asia (IDA & IBRD countries)European UnionFijiFinlandFranceGambia, TheGeorgiaGermanyGhanaGreeceGuatemalaHigh incomeHondurasHong Kong SAR, ChinaHungaryIBRD onlyIcelandIDA blendIndiaIndonesiaIran, Islamic Rep.IraqIrelandIsraelItalyJamaicaJapanJordanKazakhstanKenyaKorea, Rep.Late-demographic dividendLatin America & Caribbean Latin America & Caribbean (excluding high income)Latin America & the Caribbean (IDA & IBRD countries)LatviaLebanonLiberiaLithuaniaLuxembourgMacao SAR, ChinaMacedonia, FYRMadagascarMaltaMauritiusMexicoMoldovaMongoliaMoroccoMozambiqueNamibiaNetherlandsNew ZealandNorth AmericaNorwayOECD membersPanamaPapua New GuineaParaguayPeruPolandPortugalPost-demographic dividendRomaniaRussian FederationSan MarinoSao Tome and PrincipeSerbiaSeychellesSlovak RepublicSloveniaSmall statesSouth AfricaSouth AsiaSouth Asia (IDA & IBRD)SpainSri LankaSt. Kitts and NevisSwedenSwitzerlandSyrian Arab RepublicTajikistanThailandTrinidad and TobagoTunisiaTurkeyUkraineUnited Arab EmiratesUnited KingdomUnited StatesUpper middle incomeUruguayVenezuela, RBZambiaZimbabwe

línea de tiempo (timeline):

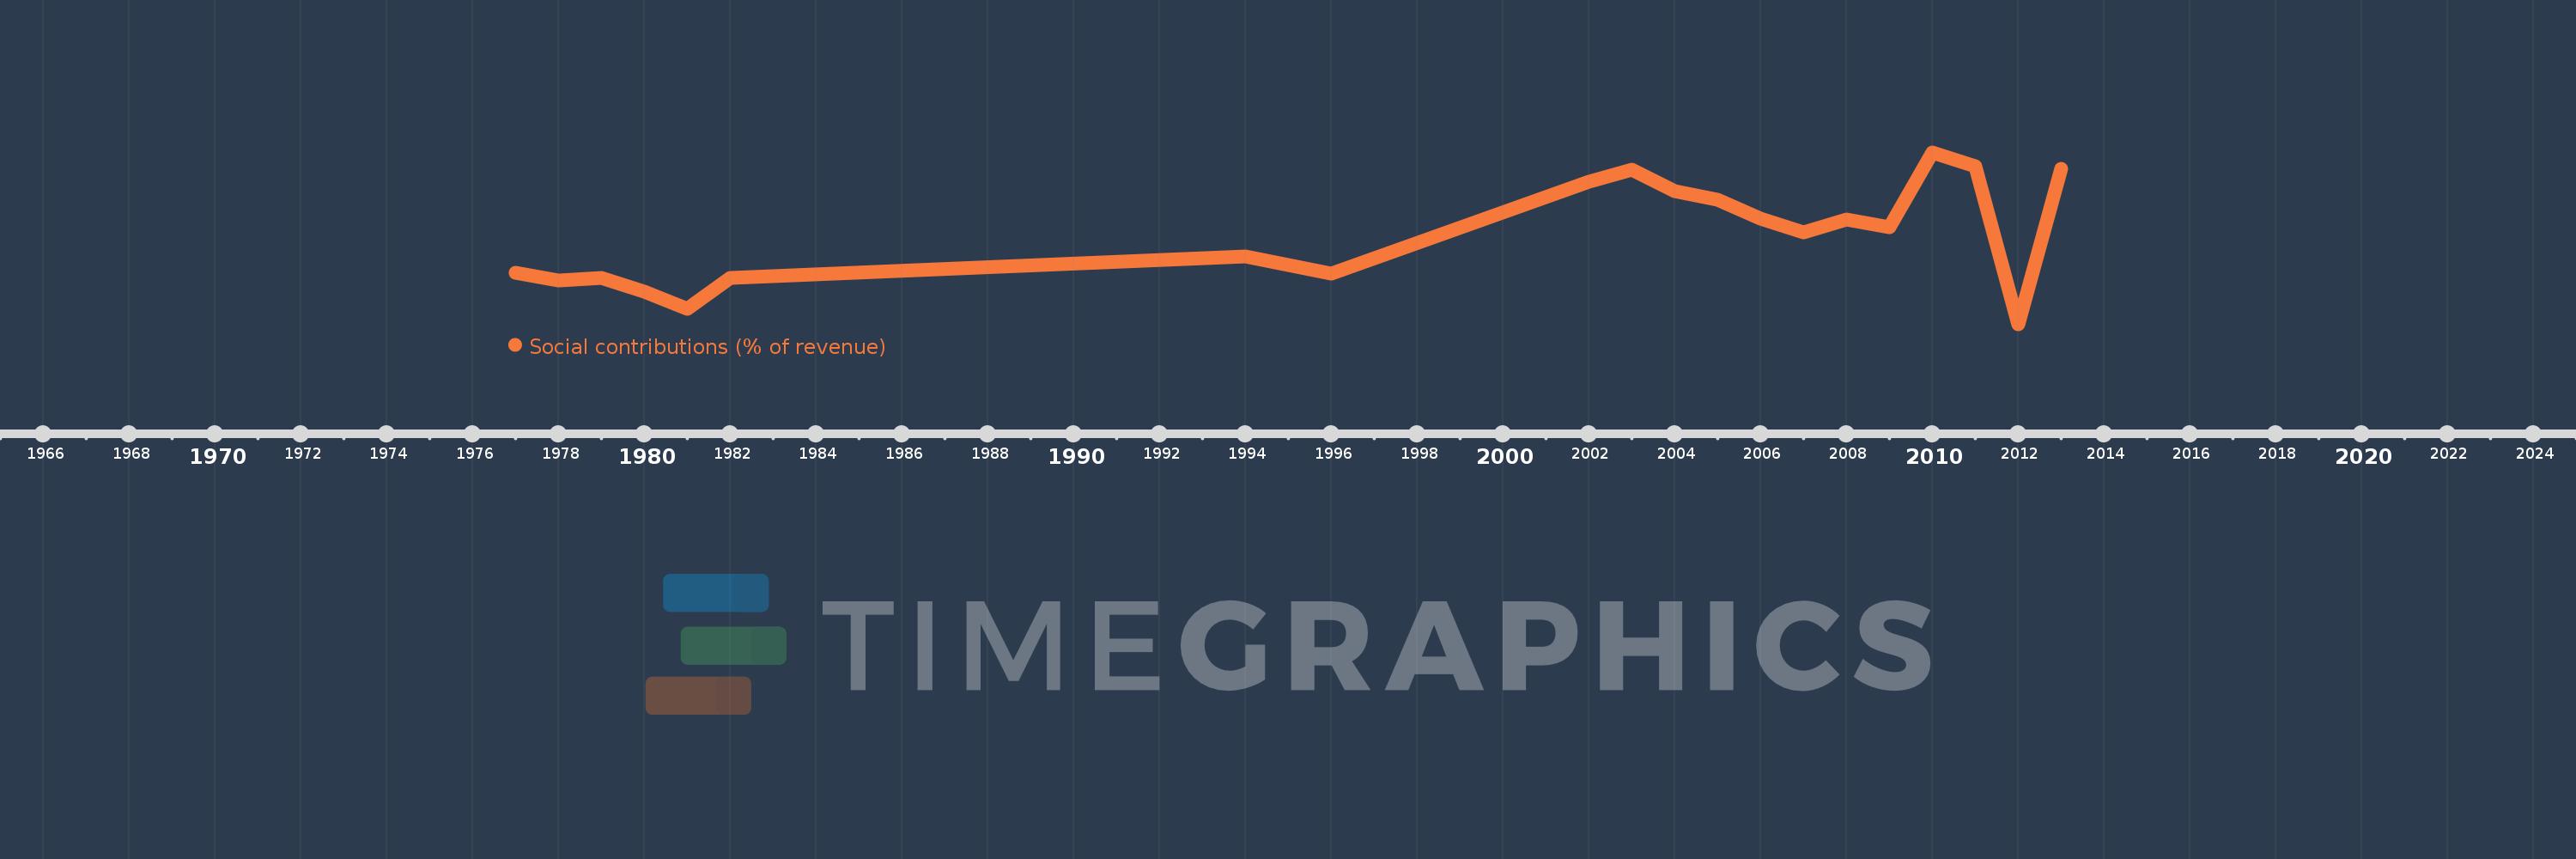
En esta escala de tiempo se presenta un gráfico de 1977 y 2013 de Trinidad and Tobago. Los datos de 1976 están ausentes. El número de observaciones reales por fecha: 21.

Fuente (nombre):

Indicadores del desarrollo mundial

Fuente (organización):

International Monetary Fund, Government Finance Statistics Yearbook and data files.

Categorías:

Public Sector

Se ha actualizado:

23 abr 2017 año

Los indicadores de los cambios de valor en los últimos años

En promedio:
3.443
Mínimo:
0.459
1 ene 2012 año
Máximo:
6.27
1 ene 2010 año
A la fecha de observación
Valor
Cambio absoluto
El cambio con respecto al valor anterior
1 ene 1977 año
2.213
+2.213
0.0%
1 ene 1978 año
1.952
-0.261
-11.8%
1 ene 1979 año
2.014
+0.062
3.17%
1 ene 1980 año
1.561
-0.453
-22.48%
1 ene 1981 año
0.972
-0.59
-37.77%
1 ene 1982 año
2.025
+1.053
108.41%
1 ene 1994 año
2.751
+0.726
35.87%
1 ene 1995 año
2.459
-0.292
-10.61%
1 ene 1996 año
2.16
-0.299
-12.18%
1 ene 2002 año
5.283
+3.123
144.61%
1 ene 2003 año
5.686
+0.403
7.63%
1 ene 2004 año
4.966
-0.72
-12.66%
1 ene 2005 año
4.66
-0.306
-6.16%
1 ene 2006 año
4.037
-0.623
-13.38%
1 ene 2007 año
3.565
-0.472
-11.7%
1 ene 2008 año
3.999
+0.434
12.17%
1 ene 2009 año
3.74
-0.258
-6.45%
1 ene 2010 año
6.27
+2.53
67.63%
1 ene 2011 año
5.809
-0.461
-7.35%
1 ene 2012 año
0.459
-5.35
-92.09%
1 ene 2013 año
5.711
+5.252
1.14 mil%

Ranking de los países por los datos estadísticos actuales